
Basic Documentation

120 / 130
Siemens M-bus level converter and M-bus web server A6V11157985_en--_f
Smart Infrastructure Web server browser operation 2021-06-21
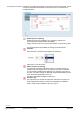
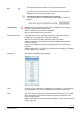
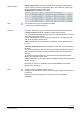
The trend data is saved to an Excel worksheet.
A trend file is set up as follows:
Plant data
This area displays the creation date of the trend file with time as well as
plant data and the number of connected devices.
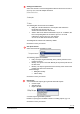
Timeframe
This area indicates the query interval as well as the timeframe for reading
out meter data. The query interval displayed here corresponds to the
shortest query interval that was set for a device in this trend file.
Additional information on query intervals is available below in this section.
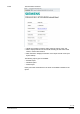
Meter readout data
This area summarizes the meter information by column. This includes the
device ID (fabrication number), readout interval, and read out data point.
Additional information on query intervals is available below in this section.
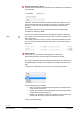
Date / time
The data and time are indicated in the first two columns.
The data and time of the readout with the corresponding meter data is
displayed per line. The time intervals correspond to the shortest query
interval that was set for a device.
Additional information on query intervals is available below in this section.
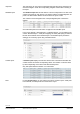
Meter data
This area displays the values of read out data point per meter. A column
corresponds to a meter.
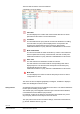
The meter can also be depicted graphically in a diagram, in addition to display in
tables. Use the diagram function in Excel.
An individual query interval can be defined for each device. The interval determines
the time span for reading out the device.
The shortest query interval applies to the time span in the trend file if individual,
connected devices have different query intervals.
For example, a value for the device is only entered in the trend file every seven
days if a query interval of seven days is set for the device.
The query interval can be set in the device settings, see Section "Wired devices,
pg. 89 and "Wireless devices", pg. 100.
Query interval
5