
Data Sheet for Product

6
Smart Infrastructure
CE2N5372en
2021-12-
07
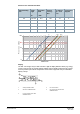
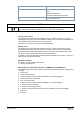
The meter's display is subdivided into several loops.
A short press on the button (<2 s) lets the current loop pass through line by line. The first line
displays again after the last line. A long press (>3 s) displays the first line of the next loop.
The first loop is displayed again after the last loop.
The arrow icons mark the display of a stored value of the previous year or previous month. A
calibrated value (e.g. energy) is marked on the display by a star symbol. The decimal places
of displayed values are indicated by a frame.
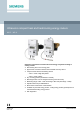
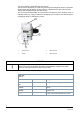
1 Calibration seal 3 Optical interface
2 Display 4 Optical interface
NOTICE
The range of display and the displayed data may deviate from this description and certain
button functions may be disabled, depending on the parameter settings on the meter.
Moreover, certain push button functions can be locked.
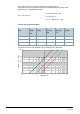
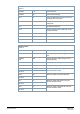
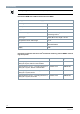
User loop
LOOP 0
1234567 kWh Energy amount heat
1234567
cold
kWh Energy amount cooling (optional)
1234567 m
3
Volume
0000000 Segment test
F------- In case of error message with error code
2
3
4
1