
Network Hardware User Manual

214 U3585-J-Z125-8-76
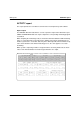
ACTIVITY report SM2 reports
Monitoring information
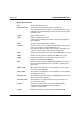
TASKS (CURRENT TASK TYPE)
BATCH Average number of batch tasks during the monitoring cycle
DIALOG Average number of interactive tasks during the monitoring cycle
TP Average number of TP tasks during the monitoring cycle
SYS Average number of system tasks during the monitoring cycle
#-TASKS Average number of all tasks logged on to the system during the
monitoring cycle
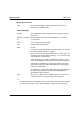
Note
All batch, interactive, TP and system tasks are assigned to the TYPE to which they
belong at the time of sampling.
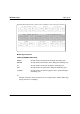
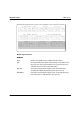
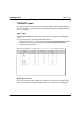
D016ZE04 SM2 ACTIVITY (VM) CYCLE: 120 S SAMPLES: 293 99-03-24 14:30:00
CPU UTILIZATION ( 2 LM'S) PCS DATA IO'S PER SEC
+------+------+------+------+------+ +-------+------+ +-------+-------+-------+
| TU | TPR | SIH | IDLE | /390 | | SRACT |RDACT | | TOTAL | DISK | PAGE |
+------+------+------+------+------+ +-------+------+ +-------+-------+-------+
| 22.6%| 22.5%| 10.4%| 44.3%| 0.0%| | 42739| 1.0| | 402.7 | 210.5 | 0.0 |
+------+------+------+------+------+ +-------+------+ +-------+-------+-------+
TASKS (CURRENT TASK TYPE) TASKS IN SCHEDULER QUEUES
+-------+-------+-------+-------+-------+ +--------+--------+--------+--------+
| BATCH| DIALOG| TP | SYS |#-TASKS| | #-ACT | CPU-Q | IO-Q | PAG-Q |
+-------+-------+-------+-------+-------+ +--------+--------+--------+--------+
| 62.0| 368.5| 46.0| 198.8| 675.6| | 95.0 | 1.7 | 2.7 | 0.0 |
+-------+-------+-------+-------+-------+ +--------+--------+--------+--------+
MEMORY POSIX DATA RESPONSE STATISTICS
+--------+--------+--------+ +--------+---------+ +-------+-------+-------+
| NPP | WS-ACT |WS-WACT | | SCALL/S| FORK/S | |NRESP/S| ART(S)| ATT(S)|
+--------+--------+--------+ +--------+---------+ +-------+-------+-------+
| 480617 | 8915 | 0 | | 490.6 | 0.3 | | 38.2 | 0.1 | 0.6 |
+--------+--------+--------+ +--------+---------+ +-------+-------+-------+