
User's Manual

2-77
1010NFM-3J
Section 2
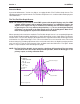
Signal Masking Function: (Hot Key 7)
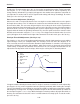
Under conditions of extremely low signal amplitude, a noise spike associated with 1010’s receive
signal window may be present on the extreme left side of the graph display. If this spike is large enough
it may interfere with the signal detection routines. To eliminate this noise from the signal processing
routines, press the <7> key to invoke the [MaskSet] command, then press the <+> key until the noise
is no longer present in the receive waveform. Press <0> to exit this command.
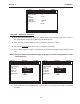
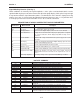
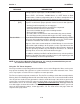
Screen Text
Parameters Menu List item Description
F Flow Measured flow rate in selected flow units.
VS Vs (m/s) Sound Velocity in meters per second.
[ ] Display Metrics Represents the digital sample position of the receive window.
Correlated Plot Displays the receive waveform in its proper superposition or registra-
tion. The true delta time will be displayed by NOT selecting “Corre-
lated Plot”.
Centroid Mark Indicates with a large vertical marker the peak energy of the receive
waveform.
D Damping Displays the minimum and maximum digital damping exponent along
with the active damping exponent.
Tn Tn (usec) Receive signal transit time in microseconds.
dT Delta T (nsec) Transit time delta (difference) in nanoseconds.
S Signal Strength Displays %Valc (amplitude), %Vaer (aeration factor) and numeric ALC.
SN Signal to Noise Ratio Indicates the signal to noise ratio of the receive signal. Increased
damping will increase the S/N ratio as the asynchronous noise re-
duces.
Envelope Signature Percentage change of the signal from Initial Makeup conditions.
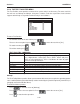
DESCRIPTION OF GRAPH SCREEN TEXT DISPLAY PARAMETERS
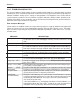
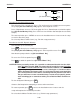
Key Command Line Description
<+> Expands (magnifies) waveform to view more detail.
<-> Contracts waveform to view more or the waveform.
<Left Arrow> Shifts receive window to the left (waveform to the right).
<Right Arrow> Shifts receive window to the right (waveform to the left).
<CLR> Brings waveform to the center of the screen.
<ENTER> Calls up Text Display menu items. <Left Arrow> to return to graph.
<MENU> Exits the Graph Screen and returns to the main menu.
<1> MinDamp Minimum damping exponent control (+ or - to increase or decrease).
<2> MaxDamp Maximum damping exponent control (+ or - to increase or decrease).
<3> TnSet Transit time adjustment (use + or - to move Tn marker).
<4> ZCOSet Zero Crossover adjustment (use + or - to move crossover marker).
<5> HiSet Signal envelope threshold level (use + or - to move threshold).
<6> LoSet Signal envelope threshold level (use + or - to move threshold).
<7> MaskSet Leading edge masking functions (use + or - to alter number of samples
masked).
<8> Hold Set Set this number higher if intermittant mis-registration occurs.
<0> Exits the command line.
<=> Toggle graph between receive waveform and envelope waveform.
<F1> and <.> Dumps the digitized waveform data over the RS232 port. You must first
leave the Graph Screen mode before invoking this command.
HOT KEY SUMMARY