
User Manual
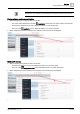
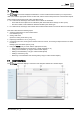
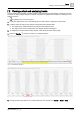
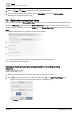
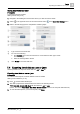
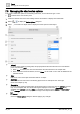


Table Of Contents
- 1 About this document
- 2 Overview
- 3 Plant view
- 4 Alarms
- 5 Scheduler
- 6 List view
- 7 Trends
- 8 Reports
- 9 Documents
- 10 General settings
- Index

Trends
User interface
7
44
| 64
A6V11211557_en--_g
①
Settings for the displayed chart
Select
Settings
to display or hide the
Chart View Settings
menu.
●
Save
saves the chart to the currently selected location in the building structure.
Options for saving chart views [➙ 46]
●
Save as
saves the chart with a different name.
●
Series options
customize the chart type, chart colors, etc.
Managing the chart series options [➙ 48]
●
Delete chart
deletes the currently displayed chart. This does not affect the related trend
definition.
●
Exit
closes the chart.
②
Chart legend
Outlines the colors used to plot the trended data for each object in the chart.
Changing chart colors [➙ 51]
③
Date range selector
Trended data can be displayed by the
Day
,
Week
,
Month
, or
Year
.
● The default display is
Today
.
● Click the center of the
Date range selector
to display a calendar for selecting other timeframes.
● Select to display the previous timeframe or select to display the next timeframe.
④
Chart view / Table view and Refresh buttons
● Select
Chart
or
Table
to change the format of the displayed data. The default view is a
chart.
● Select
Refresh
to update the trend data used for the chart.
⑤
Manual export button
Click to export trend data as
.csv
or
.json
.
Exporting trend data as .csv or .json [➙ 47]
⑥
Charted data
● If multiple objects are selected from a single device, trend data with the same unit of measure
displays in a single chart.
● If multiple objects are selected from multiple devices, trend data is grouped by device and unit of
measure.
⑦
Chart timeline selector
Move the
Timeline
buttons to change the time period of data displayed across the x-axis. In this
example, the full timeline is displayed. To focus on the data collected between 3:00 am and 9:00 am,
you would move the left to 3:00 am and move the right to 9:00 am.