
User Manual

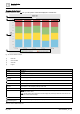

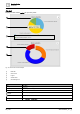


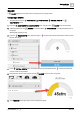

Table Of Contents
- 1 About this document
- 2 Commissioning
- 2.1 Default connection
- 2.2 Initial login
- 2.3 Setup wizard
- 2.4 Discover and assign devices
- 2.5 Subscribing to the time master
- 2.6 Time synchronization of the time master
- 2.7 Registering as a foreign device
- 2.8 Touch panel settings
- 2.9 Operating and monitoring features
- 3 Data point integration
- 4 Graphic features
- 4.1 Plant view Tools
- 4.2 Kiosk graphics
- 4.3 Engineering notations
- 5 Graphics Builder
- 5.1 Overview
- 5.2 Pane tools
- 5.3 Graphics libraries
- 6 Graphics engineering
- 6.1 Using supersample graphics
- 6.2 Optimizing graphics for PXM touch panels and standard devices
- 6.3 Thumbnails
- 6.4 Dashboards
- 7 Advanced functionality
- 8 Tips and tricks
- 8.1 Updates required after a time zone change
- 8.2 APPLY BATCH TAGS
- 8.3 Graphic components within models cannot be modified
- 8.4 A graphic with relative binding that includes data points from different branches of the hierarchy cannot be created at the Root level
- 8.5 Relative hyperlinks cannot be added to a graphic at the Root level
- 8.6 Relative hyperlinks in a graphic are broken if the graphic is engineered offline and then imported to another device
- 8.7 Automatic logout from Desigo Control Point causes Graphics Builder to temporarily stop working
- 8.8 Detection of network interruptions
- 8.9 Cancelling a kiosk log out sequence
- 8.10 Special characters do not display in graphic file names
- 8.11 The color of a graphical component may display incorrectly if the component was copied
- Index

Graphics Builder
Pane tools
5
86 | 195
A6V11604297_en--_g
Configure Dashboard Component Points
Prerequisites
● Data points for the chart are available in the VIRTUAL POINTS pane.
● The Num Points field in the Configure Dashboard Comp dialog box reflects the number of data points to
display in the chart.
Data points for curVal charts are selected from a drop-down list of VIRTUAL
POINTS that are associated with the graphic. If the desired data point is not in the
list, drag-and-drop numeric points from the EQUIPMENTS pane onto the
chart. This creates new VIRTUAL POINTS that are associated with the
graphic and available in the drop-down list.
Setting
Description
Point number prompt
Select a point to display in the chart.
(Optional)
Color number prompt
To use default colors, leave this field blank. Otherwise, enter a color name (in English only), RGB, or
hex color code. For example:
● red or #FF0000 or RGB(255,0,0)
● pink or #FFC0CB or RGB(255,192,203)
● orange or #FFA500 or RGB(255,165,0)
● yellow or #FFFF00 or RGB(255,255,0)
● purple or #800080 or RGB(128,0,128)
● green or #008000 or RGB(0,128,0)
● blue or #0000FF or RGB(0,0,255)
● brown or #A52A2A or RGB(165,42,42)
● white or #FFFFFF or RGB(255,255,255)
● gray or #808080 or RGB(128,128,128)
● black or #000000 or RGB(0,0,0)
For additional color options, see https://htmlcolorcodes.com/color-names/
Table 30: Configure dashboard component points dialog box.
DATA GRID
A DATA GRID displays data in a spreadsheet-like view.
Configuring a DATA GRID
This procedure uses the PROPERTIES, COMPONENTS and VIRTUAL POINTS panes.
1. From the COMPONENTS > COMPONENTS pane, drag-and-drop onto the work area and then
select it.
2. Click at the bottom of the ADVANCED PROPERTIES pane to add a new tag.
A string tag is added.
3. Click and select MARKER to change the tag type.
4. Name the new tag basicBinding and click .