
User Manual


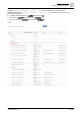


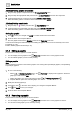


Table Of Contents
- 1 About this document
- 2 Commissioning
- 2.1 Default connection
- 2.2 Initial login
- 2.3 Setup wizard
- 2.4 Discover and assign devices
- 2.5 Subscribing to the time master
- 2.6 Time synchronization of the time master
- 2.7 Registering as a foreign device
- 2.8 Touch panel settings
- 2.9 Operating and monitoring features
- 3 Data point integration
- 4 Graphic features
- 4.1 Plant view Tools
- 4.2 Kiosk graphics
- 4.3 Engineering notations
- 5 Graphics Builder
- 5.1 Overview
- 5.2 Pane tools
- 5.3 Graphics libraries
- 6 Graphics engineering
- 6.1 Using supersample graphics
- 6.2 Optimizing graphics for PXM touch panels and standard devices
- 6.3 Thumbnails
- 6.4 Dashboards
- 7 Advanced functionality
- 8 Tips and tricks
- 8.1 Updates required after a time zone change
- 8.2 APPLY BATCH TAGS
- 8.3 Graphic components within models cannot be modified
- 8.4 A graphic with relative binding that includes data points from different branches of the hierarchy cannot be created at the Root level
- 8.5 Relative hyperlinks cannot be added to a graphic at the Root level
- 8.6 Relative hyperlinks in a graphic are broken if the graphic is engineered offline and then imported to another device
- 8.7 Automatic logout from Desigo Control Point causes Graphics Builder to temporarily stop working
- 8.8 Detection of network interruptions
- 8.9 Cancelling a kiosk log out sequence
- 8.10 Special characters do not display in graphic file names
- 8.11 The color of a graphical component may display incorrectly if the component was copied
- Index

Graphic features
Plant view Tools
4
A6V11604297_en--_g
37 | 195
④
Enabled graphics and kiosks
Graphics and kiosks with an active thumbnail image or an active generic logo can be viewed by room users. A generic logo
displays if a graphic does not have a thumbnail image.
Click the thumbnail image, the graphic name or to display a graphic or kiosk.
Thumbnails [➙ 146]
⑤
Disabled graphics and kiosks
Graphics and kiosks with a dimmed thumbnail image or dimmed generic logo are not assigned to the Desigo Control Point
device and cannot be viewed by room users.
Enable / disable graphics and kiosks [➙ 40]
4.1.1 Adding a graphic
When adding a graphic, start at the point in the building hierarchy where the graphic will be used. For example,
when creating a room segment graphic, start at a room segment in the building hierarchy. Alternately, when
creating a dashboard graphic, start at the Root of the building hierarchy.
Although a graphic is created at a particular location in the building hierarchy, adding a GRAPHIC ON query
makes the graphic available at similar locations in the building hierarchy. For example, a GRAPHIC ON query
with relative binding is applied to a room segment graphic in the building hierarchy. This room segment graphic
will be available for all room segments at the same relative position in the building hierarchy.
GRAPHIC ON binding query [➙ 63]
The options displayed in the graphics wizard are context-sensitive.
● When you add a graphic at the Root of the building hierarchy, such as a dashboard, you are only able to
select the data points to be displayed in the graphic.
● When you add a graphic to a particular location in the building hierarchy, such as a Room, you are able to
select the following options:
– Graphic backgrounds (VAV, AHU, Room operator unit, portrait or Room operator unit, landscape).
– The type of data point binding to use.
Data point binding [➙ 59]
– Data points to be displayed in the graphic.
Using the graphics wizard
1. Navigate to the building hierarchy location where the graphic will reside. For example, a Room.
2. Select > > Configure graphics > .
3. Enter a unique name.
4.
(Optional)
Select a background from the Select template drop-down list.
5. Select the type of data point binding and click Next.
– For absolute binding, select Show graphic for this equipment
– For relative binding, select Show graphic for equipment like this.
The GRAPHIC ON filter displays a query that applies to the current level of the building hierarchy. For
example, equip and plant.
Modify the query, if desired, and click Next.
A list of available equipment and data points displays.
6. Select the equipment and data points to display on the graphic and click Next.
The system creates the graphic.
7. Click OK to clear the message.
The graphic opens in Graphics Builder for further editing.
A VIRTUAL POINT has been created for every data point selected in the wizard.