
User Manual
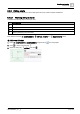
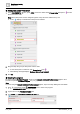

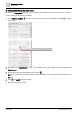


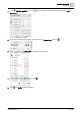
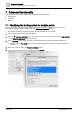


Table Of Contents
- 1 About this document
- 2 Commissioning
- 2.1 Default connection
- 2.2 Initial login
- 2.3 Setup wizard
- 2.4 Discover and assign devices
- 2.5 Subscribing to the time master
- 2.6 Time synchronization of the time master
- 2.7 Registering as a foreign device
- 2.8 Touch panel settings
- 2.9 Operating and monitoring features
- 3 Data point integration
- 4 Graphic features
- 4.1 Plant view Tools
- 4.2 Kiosk graphics
- 4.3 Engineering notations
- 5 Graphics Builder
- 5.1 Overview
- 5.2 Pane tools
- 5.3 Graphics libraries
- 6 Graphics engineering
- 6.1 Using supersample graphics
- 6.2 Optimizing graphics for PXM touch panels and standard devices
- 6.3 Thumbnails
- 6.4 Dashboards
- 7 Advanced functionality
- 8 Tips and tricks
- 8.1 Updates required after a time zone change
- 8.2 APPLY BATCH TAGS
- 8.3 Graphic components within models cannot be modified
- 8.4 A graphic with relative binding that includes data points from different branches of the hierarchy cannot be created at the Root level
- 8.5 Relative hyperlinks cannot be added to a graphic at the Root level
- 8.6 Relative hyperlinks in a graphic are broken if the graphic is engineered offline and then imported to another device
- 8.7 Automatic logout from Desigo Control Point causes Graphics Builder to temporarily stop working
- 8.8 Detection of network interruptions
- 8.9 Cancelling a kiosk log out sequence
- 8.10 Special characters do not display in graphic file names
- 8.11 The color of a graphical component may display incorrectly if the component was copied
- Index

Graphics engineering
Dashboards
6
172 | 195
A6V11604297_en--_g
② Adding data points to the chart
1. In the EQUIPMENTS pane, press CTRL and click to select all the Present value data points that are
the source for the chart.
Note: All the data points must be assigned together. They cannot be added one-by-one.
A star displays to indicate that a data point is selected.
2. Drag-and-drop the group of data points onto the chart.
A new virtual point is created for each Present value point .
The following message displays: Retrieve History From Point(s)?
3. Click No.
③ Copying the program
Pie charts use the Pie Chart Program, which is in the Sample dashboard facility manager graphic. This
procedure copies the Pie Chart Program into your graphic.
Note
If you are using the Sample dashboard facility manager graphic, skip to the Step
Editing the chart labels
.
1. Click at the bottom of the PROGRAMS pane to add a new program.
The PROGRAM EDITOR dialog box opens.
2. Type a name in the PROGRAM NAME field.
3. Type world in the PROGRAM TARGET FILTER field.