
User Manual


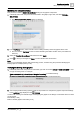
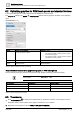

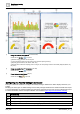

Table Of Contents
- 1 About this document
- 2 Commissioning
- 2.1 Default connection
- 2.2 Initial login
- 2.3 Setup wizard
- 2.4 Discover and assign devices
- 2.5 Subscribing to the time master
- 2.6 Time synchronization of the time master
- 2.7 Registering as a foreign device
- 2.8 Touch panel settings
- 2.9 Operating and monitoring features
- 3 Data point integration
- 4 Graphic features
- 4.1 Plant view Tools
- 4.2 Kiosk graphics
- 4.3 Engineering notations
- 5 Graphics Builder
- 5.1 Overview
- 5.2 Pane tools
- 5.3 Graphics libraries
- 6 Graphics engineering
- 6.1 Using supersample graphics
- 6.2 Optimizing graphics for PXM touch panels and standard devices
- 6.3 Thumbnails
- 6.4 Dashboards
- 7 Advanced functionality
- 8 Tips and tricks
- 8.1 Updates required after a time zone change
- 8.2 APPLY BATCH TAGS
- 8.3 Graphic components within models cannot be modified
- 8.4 A graphic with relative binding that includes data points from different branches of the hierarchy cannot be created at the Root level
- 8.5 Relative hyperlinks cannot be added to a graphic at the Root level
- 8.6 Relative hyperlinks in a graphic are broken if the graphic is engineered offline and then imported to another device
- 8.7 Automatic logout from Desigo Control Point causes Graphics Builder to temporarily stop working
- 8.8 Detection of network interruptions
- 8.9 Cancelling a kiosk log out sequence
- 8.10 Special characters do not display in graphic file names
- 8.11 The color of a graphical component may display incorrectly if the component was copied
- Index

Graphics engineering
Dashboards
6
A6V11604297_en--_g
147 | 195
3. Do one of the following:
– To upload a new image, click Choose File and select the screen capture that was saved to your
computer.
– To select an image already on the device, click the Existing Image field to select a file and select the
Use existing image check box.
4. Click Apply.
5. Click SAVE and close the graphic.
6.4 Dashboards
Dashboards are a specific application of graphics that display trend data and present values in elements, such
as bar charts, pie charts and gauges. Dashboards only display information—they do not contain elements for
commanding objects.
When working with dashboards, it is recommended that you start with a sample dashboard from the
Supersample graphics library and use SAVE AS GRAPHIC to save your customized version. The
Supersample graphics library contains the following sample dashboard graphics:
● Sample dashboard facility manager, which provides a facility manager with detailed information regarding
the energy consumption of a building
Facility manager dashboard [➙ 147]
● Sample dashboard public, which is designed for use in public spaces to share information about a building.
Public dashboard [➙ 152]
The sample dashboard graphics have been designed to require minimal set-up. Most users only need to add
trend definitions for the data to be displayed and add the data sources to the graphic.
Configuring the Facility manager dashboard [➙ 148]
Configuring the Public dashboard [➙ 153]
Navigation in Graphics Builder and the procedures to import, export and edit dashboard graphics are the same
as with any other graphic. Creating new dashboard graphics (rather than starting with a sample graphic) is an
advanced task. See the following sections of this manual for more information:
● Importing graphics [➙ 40]
● Exporting graphics [➙ 39]
● Editing a graphic [➙ 38]
● Adding a graphic [➙ 37]
6.4.1 Facility manager dashboard
The Sample dashboard facility manager graphic provides a facility manager with detailed information regarding
the energy consumption of a building. .