
User Manual

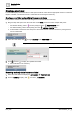

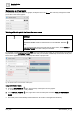


Table Of Contents
- 1 About this document
- 2 Commissioning
- 2.1 Default connection
- 2.2 Initial login
- 2.3 Setup wizard
- 2.4 Discover and assign devices
- 2.5 Subscribing to the time master
- 2.6 Time synchronization of the time master
- 2.7 Registering as a foreign device
- 2.8 Touch panel settings
- 2.9 Operating and monitoring features
- 3 Data point integration
- 4 Graphic features
- 4.1 Plant view Tools
- 4.2 Kiosk graphics
- 4.3 Engineering notations
- 5 Graphics Builder
- 5.1 Overview
- 5.2 Pane tools
- 5.3 Graphics libraries
- 6 Graphics engineering
- 6.1 Using supersample graphics
- 6.2 Optimizing graphics for PXM touch panels and standard devices
- 6.3 Thumbnails
- 6.4 Dashboards
- 7 Advanced functionality
- 8 Tips and tricks
- 8.1 Updates required after a time zone change
- 8.2 APPLY BATCH TAGS
- 8.3 Graphic components within models cannot be modified
- 8.4 A graphic with relative binding that includes data points from different branches of the hierarchy cannot be created at the Root level
- 8.5 Relative hyperlinks cannot be added to a graphic at the Root level
- 8.6 Relative hyperlinks in a graphic are broken if the graphic is engineered offline and then imported to another device
- 8.7 Automatic logout from Desigo Control Point causes Graphics Builder to temporarily stop working
- 8.8 Detection of network interruptions
- 8.9 Cancelling a kiosk log out sequence
- 8.10 Special characters do not display in graphic file names
- 8.11 The color of a graphical component may display incorrectly if the component was copied
- Index

Graphics Builder
Pane tools
5
A6V11604297_en--_g
133 | 195
Adding a component to a layer
1. In the LAYERS pane, select the layer to which the component is being added.
2. Drag-and-drop an element from the COMPONENTS pane onto the selected layer.
For example, select the Energy layer in the Sample dashboard public graphic and drag-and-drop an HTML
COMPONENT onto it.
Moving a component to a different layer
1. In the LAYERS pane, select the component to move.
2. Drag-and-drop the component onto the desired layer.
For example, drag the Label component from the Cooling layer and drop it onto the Weather layer.
Fig. 34: Moving an element to a different layer.
5.2.4 VIRTUAL POINTS
The VIRTUAL POINTS pane displays the data points that belong to the graphic.
A virtual point is created for every data point used in the graphic. Each virtual point has a binding property that
displays the ID or query that fetches information from a data point at runtime. A single virtual point can be
associated with many graphic components.
Use the VIRTUAL POINTS pane to do the following:
● Create smart labels [➙ 134].
● Bind data points to a graphic component [➙ 135].
● Rename a virtual point [➙ 136].
● Add a new tag or property tag to a data point [➙ 138].
Indicator
Name
Description
Object
Adds a property tag to the virtual point.
Add
Adds a new virtual point.
Delete
Deletes the selected virtual point.
Table 63: VIRTUAL POINTS pane icons.