
User Manual
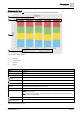


Graphics Builder
Pane tools
5
A6V11604297_en--_e
85 | 196
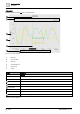
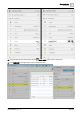
Configure Dashboard Component Points
Prerequisites
● Data points for the chart are available in the VIRTUAL POINTS pane.
● The Num Points field in the Configure Dashboard Comp dialog box reflects the number of data points to
display in the chart.
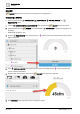
Data points for curVal charts are selected from a drop-down list of VIRTUAL
POINTS that are associated with the graphic. If the desired data point is not in the
list, drag-and-drop numeric points from the EQUIPMENTS pane onto the
chart. This creates new VIRTUAL POINTS that are associated with the
graphic and available in the drop-down list.
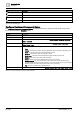
Setting
Description
Point number prompt
Select a point to display in the chart.
(Optional)
Color number prompt
To use default colors, leave this field blank. Otherwise, enter a color name (in English only), RGB, or
hex color code. For example:
● red or #FF0000 or RGB(255,0,0)
● pink or #FFC0CB or RGB(255,192,203)
● orange or #FFA500 or RGB(255,165,0)
● yellow or #FFFF00 or RGB(255,255,0)
● purple or #800080 or RGB(128,0,128)
● green or #008000 or RGB(0,128,0)
● blue or #0000FF or RGB(0,0,255)
● brown or #A52A2A or RGB(165,42,42)
● white or #FFFFFF or RGB(255,255,255)
● gray or #808080 or RGB(128,128,128)
● black or #000000 or RGB(0,0,0)
For additional color options, see https://htmlcolorcodes.com/color-names/
Table 30: Configure dashboard component points dialog box.
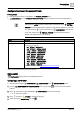
DATA GRID
A DATA GRID displays data in a spreadsheet-like view.
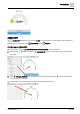
Configuring a DATA GRID
This procedure uses the PROPERTIES, COMPONENTS and VIRTUAL POINTS panes.
1. From the COMPONENTS > COMPONENTS pane, drag-and-drop onto the work area and then
select it.
2. Click at the bottom of the ADVANCED PROPERTIES pane to add a new tag.
A string tag is added.
3. Click and select MARKER to change the tag type.
4. Name the new tag basicBinding and click .