
User Manual


Graphics Builder
Pane tools
5
A6V11604297_en--_e
83 | 196
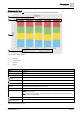
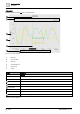
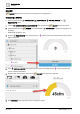
Pie chart
Displays current values (curVal) for up to ten points.
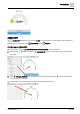
Figure 13: Pie and Donut chart examples.
①
Main Title
②
Chart Cursor
③
Legend
④
Animate Slice
⑤
Show Background
Field
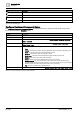
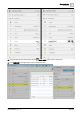
Description
Chart type
Current Val is the only option.
Number of points
Number of points to display in the chart. Maximum is 10.
Timer
(Optional)
Select a timer to set a refresh interval for the chart data.
Legend
Select to display a legend below the chart.
Dimension 3
Select to display a three-dimension chart.
Chart type
Select Pie Chart or Donut Chart.
1
4
3
2
5