
User Manual


Graphics Builder
Pane tools
5
A6V11604297_en--_e
81 | 196
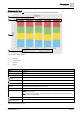
Column stacked chart
Displays historical data (his) for up to ten points. Values are displayed in vertical bars.
Figure 11: Column stacked example.
①
Main Title
②
Chart Scrollbar
③
Side Title
④
Legend
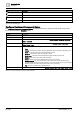
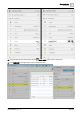
Setting
Description
Chart type
Historical is the only option.
Number of points
Number of points to display in the chart. Maximum is 10.
Timer
(Optional)
Select a timer to set a refresh interval for the chart data.
Legend
Select to display a legend below the chart.
Chart Cursor
Select to display the cursor and data point value when scrolling over the chart.
Chart Scrollbar
Select to display a scrollbar at the top. Resize the scrollbar to zoom.
Main Title
(Optional)
Enter a title to display at the top of the chart.
Side Title
(Optional)
Enter a title to display at the side of the chart.
Stacked
Regular – Each bar’s length indicates a numeric value. Each bar is comprised of a number of sub-bars that
indicate intermediate values.
100% - All bars are the same height. Each sub-bar displays the percentage contribution to the whole. See
the Figure
Column stacked example
.
Dimension 3
Select to display a three-dimension chart.
Show Background
Select to make the background opaque and display a frame around the chart.
Table 26: Column Stacked dialog box.
3
1
2
4