
User Manual

Graphics Builder
Pane tools
5
78 | 196
A6V11604297_en--_e
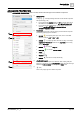
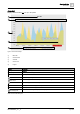
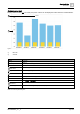
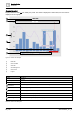
Column chart
Displays historical data (his) or current values (curVal) for up to ten points. Values can be displayed in either
vertical or horizontal bars.
Figure 8: Column chart example.
①
Main Title
②
Y Axis Max
③
Side Title
④
Show Background
⑤
Y Axis Min
Field
Description
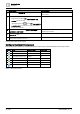
Chart type
Select Current Val or Historical.
Number of points
Number of points to display in the chart. Maximum is 10.
Timer
(Optional)
Select a timer to set a refresh interval for the chart data.
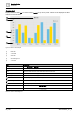
Main Title (➀)
(Optional)
Enter a title to display at the top of the chart.
Side Title (2)
(Optional)
Enter a title to display at the side of the chart.
Rotate
Select to display the columns horizontally.
Show Background
Select to make the background opaque and display a frame around the chart.
Y Set Min Max
Select to specify minimum and maximum values for the Y axis.
Y Axis Min
Enter a Y axis minimum value if Y Set Min Max is selected.
Y Axis Max
Enter a Y axis maximum value if Y Set Min Max is selected.
Table 23: Column Chart dialog box.
3
1
5
2
4