
User Manual

Graphics Builder
Pane tools
5
76 | 196
A6V11604297_en--_e
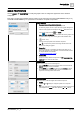
Workflow step
More information
1
Create trend(s) for Historical (his) charts.
See
Trends tools
in the
Desigo Control Point Operation Manual
(A6V11211557).
2
Create the dashboard component.
● Drag-and-drop a chart from COMPONENTS > AM
CHARTS onto the work area.
●
(Optional)
Drag-and-drop from the COMPONENTS
> COMPONENTS pane onto the work area to set a refresh
interval for the chart data.
See TIMER [➙ 99] to set a refresh interval.
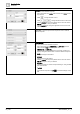
3
Right click on the chart and select TOOLS > CONFIGURE
DASHBOARD COMPONENT.
Use the appropriate table in the Configure Dashboard
Component [➙ 76] section.
4
Specify the time range and how data should be summarized in
Historical (his) charts.
See Configure Dashboard Component History [➙ 84].
5
Select the data points to display, and
(optional)
select a color to
represent each data point in the chart.
See Configure Dashboard Component Points [➙ 85].
Table 20: Basic workflow for AM CHARTS.
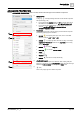
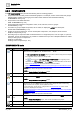
Configure Dashboard Component
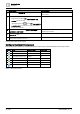
The following table outlines the number of data points and the type of data supported for each type of chart.
Indicator
Name
Number of points
Type of data
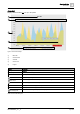
Area chart [➙ 77]
10 maximum
his
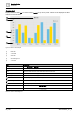
Column chart [➙ 78]
10 maximum
his or curVal
Column layered chart [➙ 79]
exactly 2
his
Column line chart [➙ 80]
exactly 2
his
Column stacked chart [➙ 81]
10 maximum
his
Line chart [➙ 82]
10 maximum
his
Pie chart [➙ 83]
10 maximum
curVal
Table 21: AM CHARTS properties.