
User Manual

Graphics Builder
Pane tools
5
74 | 196
A6V11604297_en--_e
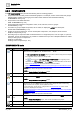
5.2.2 COMPONENTS
The COMPONENTS pane provides the following tools for creating graphics:
● Components that are mainly used for dashboard graphics. For example, tools to create charts and gauges,
embed graphics, display a motion jpeg and create custom interfaces with the RactiveJS library.
COMPONENTS tools [➙ 74]
● Components to add HTML elements.
HTML COMPONENTS [➙ 101]
● Components that simplify the configuration of bar, circle, half-circle, and icon gauges.
SVG GAUGES [➙ 118]
● A container to group multiple components, act as a label, or display the curVal of a virtual point.
TITLES AND CONTAINERS [➙ 131]
● Images for physical components, such as central plant components, coils, dampers, ducts and fans.
Graphics components [➙ 141]
● Pre-built groups of components that model the behavior of a single data point, such as a light, or a piece of
equipment, such as an exhaust fan. Any models or animations that you save in Graphics Builder are added
to the pre-built groups of components.
Graphics models library
Creating custom components [➙ 181]
COMPONENTS tools
Indicator
Name
Description
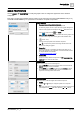
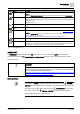
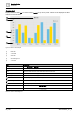
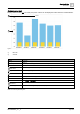
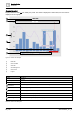
AM|CHART [➙ 75]
Displays historical data (his) from a query or the current value (curVal) of a virtual point. For example,
column, bar, line, area, pie, funnel, XY, and bubble charts.
● The COMPONENTS > AM CHARTS category provides a series of dialog boxes that simplify
the configuration of area, column, line, and pie charts.
● The component in the COMPONENTS > COMPONENTS pane is typically used in
combination with a PROGRAM and a GROUP. For more information, see the
Demos
section of www.amcharts.com and the J2
GB AM Charts
documentation
(https://finproducts.atlassian.net/wiki/spaces/FINFramework/pages/770708970/GB+AM+Charts).
Availability
Only available on devices that support the dashboard feature.
Example
Used in the Sample Dashboard Facility Manager graphic.
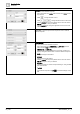
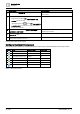
DATA GRID [➙ 85]
Displays data in a spreadsheet-like view.
GAUGE [➙ 88]
Displays the current value (curVal) of a virtual point in a gauge format.
Example
Used in the Sample Dashboard Facility Manager graphic.
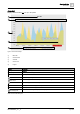
AM|GAUGE [➙ 89]
Displays the current value (curVal) of a virtual point in a gauge format. Can display multiple axes,
multiple arrows and color bands on the axis. Typically used to display data which is shown using
gauges in real life, such as speed, volume equalizer or a clock.
For more information, see the
Demos > Gauges
section of www.amcharts.com and the J2
GB
Components, AM|Gauge
documentation
(https://finproducts.atlassian.net/wiki/spaces/FINFramework/pages/770708403/GB+Components#GB
Components-AM|Gauge).
Availability
Only available on devices that support the dashboard feature.
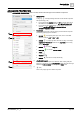
GRAPHIC INCLUDE
[➙ 90]
Creates a frame that embeds a graphic in another graphic. This is similar to an iframe element.
Example
Used in the Sample Room Segment graphic, which includes the default HVAC graphic.
GROUP [➙ 92]
Holds components together for making models.
BASIC IMAGE [➙ 93]
Displays an image.