
User Manual

Graphic features
Plant view Tools
4
A6V11604297_en--_e
35 | 196
User interface
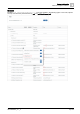
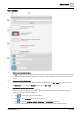
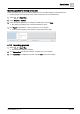
①
Root icon and breadcrumb navigation
Click to navigate to the top of the hierarchy for all devices being monitored. Graphics at this level are designed to encompass
an entire project and display data from multiple sites. For example, a dashboard graphic that displays data for all fire sensors in
a project.
②
Lower levels of the building hierarchy
Graphics in lower levels of the building hierarchy are designed to display data at the site or equip level, such as a room. Click
the Object name or to display the Graphics list for the selected site or equip.
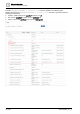
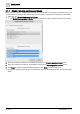
③
Magic bubbles / additional object properties
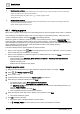
Click the icon for the object type (ⓐ), for example , to open the
magic bubbles
(ⓑ), which display additional object
properties that are used for engineering graphics.
● Click to copy the tags for the object to the clipboard.
● Click to copy the baUniqueId for the object to the clipboard.
● Click to display the shortName, navName, Object name and nodeSubType for the object.
● The bottom bubble displays the icon for the object type and the location of the object in the building hierarchy.