
User Manual

Advanced functionality
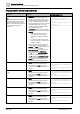
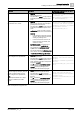
Creating a button to command multiple data points
7
188 | 196
A6V11604297_en--_e
Additional hints
Graphics in the Supersample graphics library may contain functionality that you want to use in your own
program. In particular, the program statusIndicatorProg may be helpful.
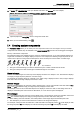
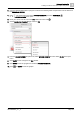
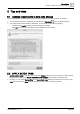
Do the following to display the code for any program in a graphic:
1. Select > > Configure graphics > Edit.
2. Select a Supersample graphic and click Edit.
3. In the PROGRAMS pane, move your cursor over the program name and click .
The program is displayed in the PROGRAM EDITOR.
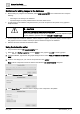
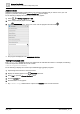
Testing the program code
The console.log() statement shows how statements are evaluated at runtime. For example, the following
code line outputs the variable value to the console:
console.log(this.writeVAL);
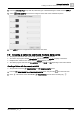
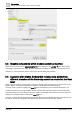
Do the following to display the console output while debugging graphic programs:
1. Open Desigo Control Point in Chrome browser.
2. Display the desired graphic in the Plant view work area.
3. Press F12 to open the Chrome DevTools pane.
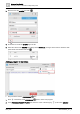
4. Click the Console tab.
5. Click the Button on the graphic.
Any console.log() statements are output to the Console tab of Chrome DevTools.