
User Manual

Graphics engineering
Dashboards
6
A6V11604297_en--_e
177 | 196
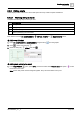
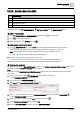
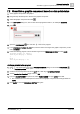
④ Displaying the Daily Max Power line
This procedure adds a property to the energy consumption data point to display the 15-minute average
maximum power demand line on the chart.
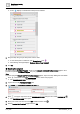
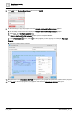
1. In the VIRTUAL POINTS pane, click for the
energy consumption
data point and select ADD
PROPERTY.
A string tag is added.
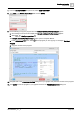
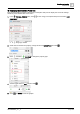
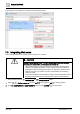
2. Scroll down to find the new property, change its name to forMaxPower and click .
3. Click and select BOOLEAN to change the property type.
4. Set the toggle switch to true (ON) and click .
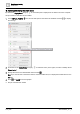
5. Click and SAVE to save the graphic.