
User Manual

Graphics engineering
Dashboards
6
174 | 196
A6V11604297_en--_e
④
(Optional)
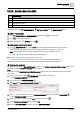
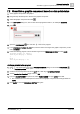
Modifying the chart labels
By default, the displayName string tag for each data point is displayed as the label in the chart. Complete
this procedure for each label to be modified.
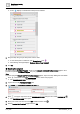
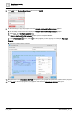
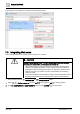
1. In the VIRTUAL POINTS pane, find the data point for the label to be modified and click to display
all of its tags.
2. Scroll down to the displayName string tag and select its value. (In the figure, the value is initially named
Present value.)
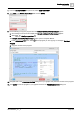
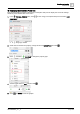
3. Change the value to the desired label name and click .
Hint: If you want to refer to the device name to create the label name, it is displayed two fields above in the
dis field.
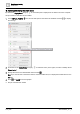
4. Click and SAVE to save the graphic.
The pie chart has been added.