
User Manual

Graphics engineering
Dashboards
6
172 | 196
A6V11604297_en--_e
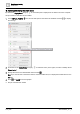
A star displays to indicate that a data point is selected.
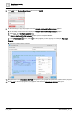
2. Drag-and-drop the group of data points onto the chart.
A new virtual point is created for each Present value point .
The following message displays: Retrieve History From Point(s)?
3. Click No.
③ Copying the program
Pie charts use the Pie Chart Program, which is in the Sample dashboard facility manager graphic. This
procedure copies the Pie Chart Program into your graphic.
Note
If you are using the Sample dashboard facility manager graphic, skip to the Step
Editing the chart labels
.
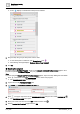
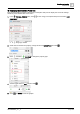
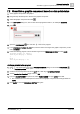
1. Click at the bottom of the PROGRAMS pane to add a new program.
The PROGRAM EDITOR dialog box opens.
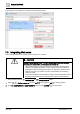
2. Type a name in the PROGRAM NAME field.
3. Type world in the PROGRAM TARGET FILTER field.
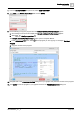
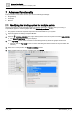
4. Click in the upper right corner of the PROGRAM EDITOR dialog box and select VARIABLES .
The PROGRAM VARS pane opens.
5. Move your cursor over the row for the this variable and then click .
6. Set the Invokes the Function? toggle switch to ON.