
User Manual

Graphics engineering
Dashboards
6
A6V11604297_en--_e
171 | 196
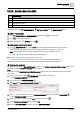
6.4.8 Editing charts
Charts display historic values from various data points and may contain complex calculations.
6.4.8.1 Working with pie charts
Complete the following steps to add a pie chart.
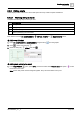
Workflow step
①
Adding an AM chart
②
Adding data points to the chart
③
Copying the program
④
(Optional)
Modifying the chart labels
This workflow uses the COMPONENTS, VIRTUAL POINTS and EQUIPMENTS panes.
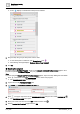
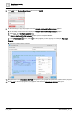
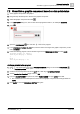
① Adding an AM chart
1. From COMPONENTS > COMPONENTS, drag-and-drop onto the graphic.
2. Click to add a new string tag .
3. Name the string tag pieChart and click .
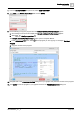
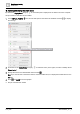
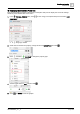
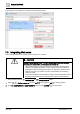
② Adding data points to the chart
1. In the EQUIPMENTS pane, press CTRL and click to select all the Present value data points that are
the source for the chart.
Note: All the data points must be assigned together. They cannot be added one-by-one.