
User Manual

Graphics engineering
Dashboards
6
A6V11604297_en--_e
163 | 196
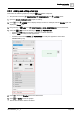
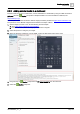
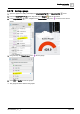
10. When you’re done editing, click to return the Weather layer to the default view.
11. Click and SAVE to save the graphic.
The new background image now displays in the dashboard.
6.4.5 Adding information from a trended data point
Information from a trended data point can be displayed in a summary graphic, such as a pie chart, or in a
comparison chart, such as those displayed in the Energy and Water tabs of the Public dashboard.
NOTICE
For optimum system performance, do the following when defining trends for data
points that are used in dashboards:
● Select the longest possible interval for saving data that is suitable for the
application.
● Select the shortest possible time for keeping trend data.
● The following selections are recommended:
For the Facility manager dashboard pie chart data, Save every 12 hours,
and Delete trend data after 2 months.
For the Public dashboard bar chart data, Save every 15 minutes, and
Delete trend data after 12 months.
This procedure uses the Public dashboard Energy tab as an example.
This procedure uses the EQUIPMENTS and LAYERS panes.
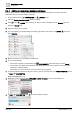
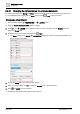
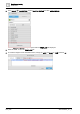
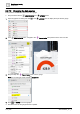
1. Open the Sample dashboard public graphic for editing.
2. Click in the LAYERS pane to display the layer to edit. For example, hide the Weather layer and
display the Energy layer.
3. In the EQUIPMENTS pane, navigate to the trended data point that is the source for the graphic.
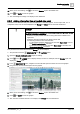
4. Drag-and-drop the trended data point onto the graphic.
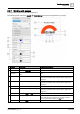
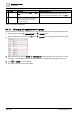
5. When you’re done editing, click to return the Weather layer to the default view.
6. Click and SAVE to save the graphic.
The “common household devices” now display in the Energy tab of the dashboard.