
User Manual

Graphics engineering
Dashboards
6
154 | 196
A6V11604297_en--_e
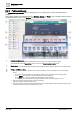
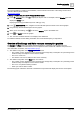
6. In the BASIC PROPERTIES, expand RACTIVE EDITOR and click OPEN EDITOR.
The RACTIVE EDITOR dialog box opens with the TEMPLATE tab displayed.
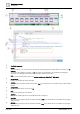
7. Paste the new HTML code in the TEMPLATE tab.
8. To scale the widget to fit the dashboard frame, change the width and height to 100% instead of px.
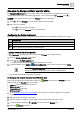
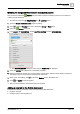
3. Adding a data source to the Energy and Water layers
A trended data point must be added to the Energy and Water layers to provide data for the comparison of the
building resource consumption to common household devices. Icons for the household devices do not display
until a trended data point has been added to the layer.
a. Adding a trend definition for online trended objects
If the trend is already defined, skip to
b. Adding a trended data point to the Energy and Water layers
.
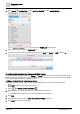
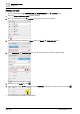
Trends is selected in the core function pane.
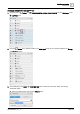
1. Select > > Configure trend definitions > .
2. Navigate through the building hierarchy and select the object(s) to trend.
Only objects that currently do not have a trend definition are displayed.
3. Click Next.
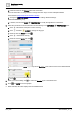
4. Select the desired settings in the Trend data collection settings dialog box.
5. Click Apply to save the trend definition.