
User Manual

Graphics engineering
Dashboards
6
A6V11604297_en--_e
153 | 196
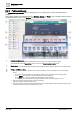
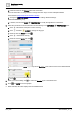
Displaying the Energy and Water layers for editing
The Sample dashboard public graphic contains three dashboard layers and a navigation bar at the top to
navigate between the layers. When editing this graphic, you may need to click Show/hide in the
LAYERS pane to display the layer to edit. The Weather layer is the default view.
1. Click to hide the Weather layer and display a different layer for editing.
2. When you’re done editing:
– Click to hide the layers you edited.
– Click to return the Weather layer to the default view.
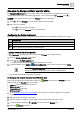
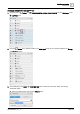
Configuring the Public dashboard
This topic outlines the workflow to configure the Public dashboard so that it displays data from your system.
Workflow step
1
Saving a copy of the sample graphic
2
Changing the location displayed in the Weather layer
3
Adding a data source to the Energy and Water layers
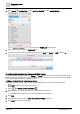
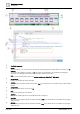
1. Saving a copy of the sample graphic
Plant view is selected and you are working at the Root of the building hierarchy.
1. Open the Sample dashboard public graphic.
2. Select > > Configure graphics > .
Graphics Builder opens the Public dashboard graphic in a new tab.
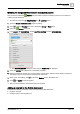
3. In Graphics Builder, select MENU > SAVE AS GRAPHIC, enter a unique file name and click SAVE.
When using SAVE AS GRAPHIC, always choose a unique graphic name. You
are not prevented from assigning the same name to multiple graphics.
The new file name displays in the tab for the graphic.
2. Changing the location displayed in the Weather layer
This procedure replaces the existing HTML code for the Ractive component in the Weather layer. The
default settings for the Weather layer are as follows:
● Location: Chicago, United States of America
● Number of days: Four
● Temperature unit: Fahrenheit
● Wind speed unit: mph
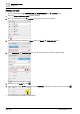
1. Go to https://www.meteoblue.com/en/weather. From the left menu, select the widget you would like to
integrate.
2. Select the options to configure your widget.
3. When the widget is configured, copy the HTML code in the field at the bottom of the page.
4. In Graphics Builder, display the LAYERS pane and expand the Weather layer.
5. Select the Ractive component.