
User Manual

Graphics engineering
Dashboards
6
152 | 196
A6V11604297_en--_e
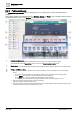
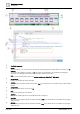
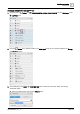
6.4.2 Public dashboard
The Sample dashboard public graphic is designed for use in public spaces to share information about a
building.
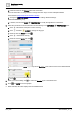
This graphic contains three dashboard layers—Weather, Energy and Water—and a navigation bar at the top to
navigate between the layers. The Weather layer is the default view.
①
Navigation bar (MainLayer)
Contains the date and time display, the tabbed buttons and the company logo. This layer is always visible.
The navigation bar uses the Toggle buttons program, which is in the Sample dashboard public graphic.
②
Weather layer
Contains a Ractive component that embeds external media to display the current weather conditions plus a three-day forecast.
③
and
④
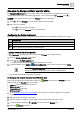
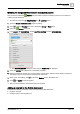
Energy ③ and Water ④ layers
● Each layer contains a Ractive component that compares the building’s resource consumption to common household
devices.
– The number of icons displayed in color represents the maximum daily consumption over the last four weeks.
– For the Energy layer, an electric oven is the default device used for comparison.
For the Water layer, a washing machine is the default device used for comparison.
To change the icons, see Overview of the Energy and Water resource consumption graphics [➙ 155]
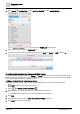
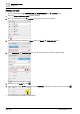
● Each layer contains a background image, which can be modified.
Adding or replacing a background image [➙ 162]
● Each layer contains a timer that refreshes the data displayed in the tab. By default, the data is refreshed every three hours.
Changing the refresh interval for a trended data point [➙ 164]