
User Manual

Graphics engineering
Dashboards
6
A6V11604297_en--_e
151 | 196
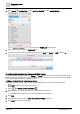
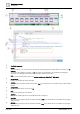
2. Drag-and-drop the group of data points onto the chart.
A new virtual point is created for each Present value point .
The following message displays: Retrieve History From Point(s)?
3. Click No.
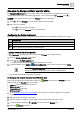
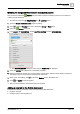
4. For each Present value point in the chart, do the following to change its label:
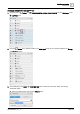
a. In the VIRTUAL POINTS pane, click to expand the point and scroll down to the displayName
string tag .
b. Select the value for the displayName string tag (initially named Present value), change it to the
desired label name and click .
Hint: If you want to use the device name, it is displayed two fields above in the dis field.
For additional details, see the Step
Editing the chart labels
in the Working with pie charts [➙ 171] section.
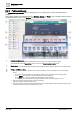
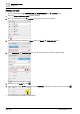
4. Setting up current values of selected objects (gauges)
Complete this procedure for each gauge in the Facility manager dashboard.
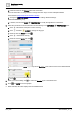
1. In the EQUIPMENTS pane, select the data point that is the source for the gauge.
2. Drag-and-drop the data point onto the gauge.
3.
(Optional)
Delete any unused gauges.
4. Click and SAVE to save the graphic.
The Facility manager dashboard configuration is now complete.