
User Manual

Graphics engineering
Dashboards
6
150 | 196
A6V11604297_en--_e
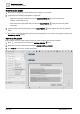
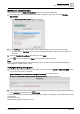
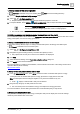
1. In the VIRTUAL POINTS pane, click for the
energy consumption
data point and select ADD
PROPERTY.
A string tag is added.
2. Scroll down to find the new property, change its name to forMaxPower and click .
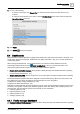
3. Click and select BOOLEAN to change the property type.
4. Set the toggle switch to true (ON) and click .
5. Click and SAVE to save the graphic.
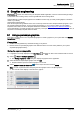
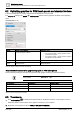
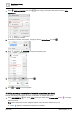
3. Setting up energy consumption of selected subsystems (pie chart)
The pie chart displays a summary of energy consumption for multiple data points.
1. In the EQUIPMENTS pane, press CTRL and click to select all the Present value points that supply
data for the chart.
Note: All the data points must be assigned together. They cannot be added one-by-one.
A star displays to indicate that a data point is selected.