
User Manual

Graphics engineering
Dashboards
6
A6V11604297_en--_e
149 | 196
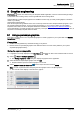
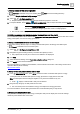
1. Saving a copy of the sample graphic
Plant view is selected and you are working at the Root level of the building hierarchy.
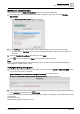
1. Open the Sample dashboard facility manager graphic.
2. Select > > Configure graphics > .
Graphics Builder opens the Facility manager dashboard graphic in a new tab.
3. In Graphics Builder, select MENU > SAVE AS GRAPHIC, enter a unique file name and click SAVE.
When using SAVE AS GRAPHIC, always choose a unique graphic name. You
are not prevented from assigning the same name to multiple graphics.
The new file name displays in the tab for the graphic.
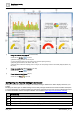
2. Setting up energy and maximum power demand (bar and line chart)
Two trended data points must be added to the Energy and maximum power demand bar and line chart: one for
energy consumption, and one for energy generation.
a. Adding a trend definition for online trended objects
If the trend is already defined, skip to
b. Adding a trended data point to the Energy and Water layers
.
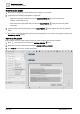
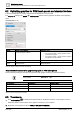
Trends is selected in the core function pane.
1. Select > > Configure trend definitions > .
2. Navigate through the building hierarchy and select the object(s) to trend.
Only objects that currently do not have a trend definition are displayed.
3. Click Next.
4. Select the desired settings in the Trend data collection settings dialog box.
5. Click Apply to save the trend definition.
For more information on adding a trend definition, see the
Trends tools
section of the
Desigo Control Point
Operation Manual
(A6V11211557).
BT Download Center
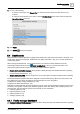
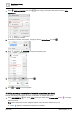
b. Adding trended data points to the bar and line chart
1. In the EQUIPMENTS pane, press CTRL and click to select one trended data point for
energy
consumption
and one trended data point for
energy generation
to supply data for the chart.
Note: The data points must be assigned together. They cannot be added one-by-one.
A star displays to indicate that a data point is selected.
2. Drag-and-drop the group of data points onto the chart.
Two new virtual points are created for energy consumption and energy generation.
For more information, see the Adding information from a trended data point [➙ 163] section.
c. Displaying the Daily Max Power line
This procedure adds a property to the energy consumption data point to display the 15-minute average
maximum power demand line on the chart.