
User Manual

Graphics Builder
Pane tools
5
132 | 196
A6V11604297_en--_e
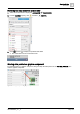
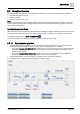
5.2.3 LAYERS
The LAYERS pane displays a hierarchical structure for all the components in a graphic. Components at the
top of the list are in the top layer of the graphic. Components lower in the list are in lower layers of the graphic.
Components can be added to a layer or moved to a different layer by dragging-and-dropping.
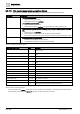
Indicator
Name
Description
Show/Hide
Shows or hides components on the graphic.
Lock
Prevents a component from being selected and moved while you are editing the graphic.
Add
Adds a new layer to the pane.
Delete
Deletes the selected component or layer and its components.
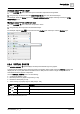
Table 62: LAYERS pane icons.
Figure 32: Hierarchical structure of the LAYERS pane.
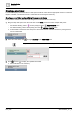
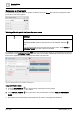
Displaying layers for editing
The Sample dashboard public graphic in the Supersample graphics library contains multiple layers and uses a
navigation bar to make one layer visible while hiding all other layers.
When a graphic with multiple layers is opened in Graphics Builder, you may need to use Show/hide to
display the layer to edit. For example, the Sample dashboard public graphic contains three dashboard layers—
Weather, Energy and Water. The Weather layer is the default view. To display the Energy or Water layer for
editing, you would do the following:
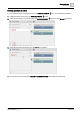
1. In the LAYERS pane, click to hide the Weather layer.
2. Click to display the layer to edit. For example, Energy.
3. When you’re done editing:
– Click to hide the control layers you edited.
– Click to return the Weather layer to the default view.