
User Manual

Graphics Builder
Pane tools
5
A6V11604297_en--_e
119 | 196
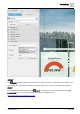
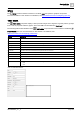
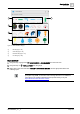
Figure 14: SVG GAUGES category.
①
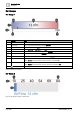
Bar Gauges [➙ 120]
②
Circle Gauges [➙ 123]
③
Half-circle Gauges [➙ 124]
④
Icon Gauges [➙ 130]
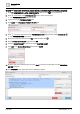
Basic workflow
1. Drag-and-drop a gauge from COMPONENTS > SVG GAUGES onto the work area.
2. Drag-and-drop a VIRTUAL POINT onto the gauge.
3. Right click on the chart and select TOOLS > CONFIGURE GAUGE. Use the appropriate table in the
following topics.
The examples in the following topics show the default colors. Enter a color name
(in English only), RGB, or hex color code to change the colors. For additional
color options, see Configure Dashboard Component Points [➙ 85] and
https://htmlcolorcodes.com/color-names/.
4
1
3
2
4