
User Manual


Trends
Managing the chart series options
7
A6V11211557_en
--_f
49 | 64
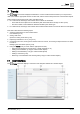
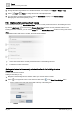
⑥
Save
Saves the selected
Series options
to the database and closes the dialog box..
⑦
Group series
Moves a sample set from one chart to another.
Moving a chart [➙ 50]
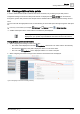
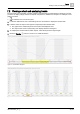
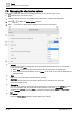
Chart view example
The following example outlines the Interval, Color, and Chart type properties for a chart view.
①
Interval
For chart views containing analog data, this property defines the time interval for the x-axis division
points.
②
Color
Outlines the colors used to plot the trended data for each object in the chart.
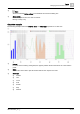
③
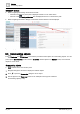
Chart type
ⓐ Column
ⓑ Line
ⓒ Curve
ⓓ Area
ⓔ Scatter
ⓕ Step
ⓖ Dashed