
User Manual


Trends
User interface
7
A6V11211557_en
--_f
43 | 64
7 Trends
The Trends core function displays trended data in a chart or table format and allows you to export trend
data. Users with the appropriate access can also add, edit and remove data points from online trended objects.
Desigo Control Point supports both online and offline trends.
● For
online
trends, the Desigo Control Point device collects the trend data.
– Trend data for each object can be collected by both timed interval and change-of-value (COV).
– The total number of trend definitions allowed is limited by the device type.
● For
offline
trends, the Desigo Control Point device retrieves data stored in the remote device’s trend objects.
This section discusses the following topics:
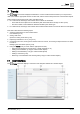
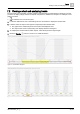
● Viewing trended data in a chart or table format
User interface [➙ 43]
● Saving chart views
Options for saving chart views [➙ 46]
● Exporting trend data as .csv or .json [➙ 47]
● Customizing the colors, chart type and interval of time for a chart, and moving a sample set from one chart
to another
Managing the chart series options [➙ 48]
● Using the Trends tools (for users with the appropriate access):
– Exporting trended data to an FTP server or email recipients [➙ 51]
– Adding a trend definition [➙ 52] (for online trended objects)
– Editing a trend definition [➙ 54] (for online trended objects)
– Adding a chart view [➙ 53]
– Removing a trend definition and archiving data [➙ 54] (for online trended objects)
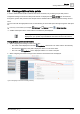
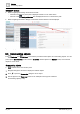
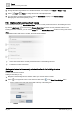
7.1 User interface
The Trends work area displays a chart view of the samples collected for a trended object.