
User Manual

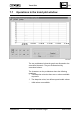


Trend Plot 124
---------------------------------------------------------------
7.8 Settings
---------------------------------------------------------------
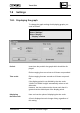
7.8.1 Displaying the graph
To change the graph settings for displaying graphs, pro-
ceed as follows:
IMMMMMMMMMMMMMMMMMMMMMMMMMMMMMMMMMMMMMMMMMM M;
: :
"Trend Plot" window
: :
Select "Settings"
: :
Select "Display"
: :
➡ "Display" window
: :
HMMMMMMMMMMMMMMMMMMMMMMMMMMMMMMMMMMMMMMMMMM M<
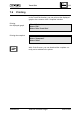
Period: Insert here the period in the graph which should be dis-
played.
Entries ranging from one minute to 99 hours are permitted.
Time scale: Entries ranging from two seconds to 99 hours are permit-
ted.
If the display period is not divisible by the time scale,
"UNIGYR-VISONIK Insight" automatically selects a suit-
able scale.
However, the time scale must be chosen such that it is
greater than the thirtieth part of the display period.
Displaying Here one has the option of displaying the time scale.
the time scale:
A line is displayed at each change of day, regardless of
this setting.
---------------------------------------------------------------
CM2B8523E UNIGYR VISONIK Insight March 1995