
User Manual


Trend Plot 123
---------------------------------------------------------------
7.7.3 Snapshot
Icon:
8522OK7E
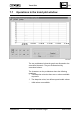
This function shows the graphically displayed values at a
particular time, numerically.
Ten "Snapshot" windows can be opened in each Trend
Plot window (max. 3).
IMMMMMMMMMMMMMMMMMMMMMMMMMMMMMMMMMMMMMMMMMM M;
Current values
: :
"Trend Plot"
: :
[Snapshot] or
: :
Select "Function"
: :
Select "Snapshot"
: :
➡ "Snapshot" window
: :
HMMMMMMMMMMMMMMMMMMMMMMMMMMMMMMMMMMMMMMMMMM M<
8522OK5E
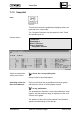
Values at a particular above the corresponding time
earlier point in time:
then proceed as described above.
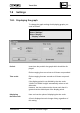
Indicating scales for Each trend channel has a pushbutton below the graph,
the trend channels: which has the colour of the displayed channel.
at any pushbutton
The pushbutton in question is now surrounded by a mark-
ing box, and the pertinent range is displayed on the verti-
cal axis of the graph.
The address of the point for the marked Trend Channel
appears simultaneously in the title bar.
---------------------------------------------------------------
CM2B8523E UNIGYR VISONIK Insight March 1995