
User Manual


Trend Plot 121
---------------------------------------------------------------
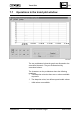
7.7.1 Stopping/Activating
The display of a trend plot can be stopped for an indefinite
period of time and then reactivated again without values
being lost.
IMMMMMMMMMMMMMMMMMMMMMMMMMMMMMMMMMMMMMMMMMM M;
Stopping:
: :
"Trend Plot" window
: :
[Stop] or
: :
Select "Function"
: :
Select "Stop"
: :
HMMMMMMMMMMMMMMMMMMMMMMMMMMMMMMMMMMMMMMMMMM M<
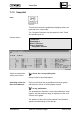
In the window title, the indication changes from "[active]" to
"(stopped)." The plot continues up to the right hand edge
of the graph and stops there.
IMMMMMMMMMMMMMMMMMMMMMMMMMMMMMMMMMMMMMMMMMM M;
Activating:
: :
"Trend Plot" window
: :
[Activate] or
: :
Select "Function"
: :
Select "Activate"
: :
HMMMMMMMMMMMMMMMMMMMMMMMMMMMMMMMMMMMMMMMMMM M<
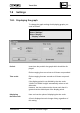
In the window title, the indication changes to "[active]"
again and the plot continues uninterruptedly.
The activating function cancels the displays generated by
the functions "Zoom In" and "Zoom Out" and sets the cur-
rent time in the middle of the graph section.
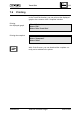
Automatic stopping: The operations listed below in the trend plot window stop
the display automatically for two minutes. However, reacti-
vating is possible earlier by actuating [Activate]:
- Zooming in or zooming out
- Placing marks
- Choice of "Snapshot"
- Moving the displayed range with the scroll bar.
---------------------------------------------------------------
CM2B8523E UNIGYR VISONIK Insight March 1995