
User Manual


Trend Plot 120
---------------------------------------------------------------
7.7 Operations in the trend plot window
---------------------------------------------------------------
8522OK3E
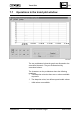
The ten pushbuttons below the graph are allocated to the
associated channels. They are characterised by
associated colours.
The characters on the pushbuttons have the following
meanings:
-! The datapoint exists but there are no values available
at present.
-? The datapoint exists, but delivers questionable values.
-. Valid values are available.
---------------------------------------------------------------
CM2B8523E UNIGYR VISONIK Insight March 1995