
User Manual


CM2N8524E / 01.1999 Siemens Building Technologies
6/12 Landis & Staefa Division
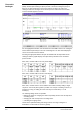
The "Trend Plot" function is an efficient tool to plot and display graphs of variable
process values.
Trend Sets with up to ten graphically displayable process values can be selectively
loaded from the server or from the hard disk file. In both cases, redefinition is easy after
call-up.
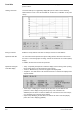
Modified or newly defined Trend Sets are always saved on the hard disk file.
The Trend Plot function provides the option of filing all data, which have arrived since
the start of a Trend Plot graphic recording, and later to reload them for renewed (offline)
display.
In addition, the data can be saved to export files.
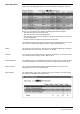
•
"Stop": Temporarily interrupts the continuous display of the incoming values. (Saving
the incoming values is not affected by the stop function.)
•
"Zoom in": Maximises any section of the graph to full display width
•
"Snapshot": The valid values of all channels at the time of selection are displayed in a
separate window.
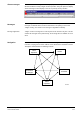
•
"Point setups": Modifying the channel-specific data such as point address and
parameter, colour, display mode (point, step, line), scale, and buffer size.
Additional process values can also be added to the Trend Plot via the "Point setups",
or a completely new Trend Set can be defined.
•
Graph setups: Modifying the data which are valid for the entire Trend Set (display
period, time scale, displaying gridlines).
Trend Plot
Loading Trend Sets
Saving Trend Sets
Operations with data
Operations during the
Trend Plot display