
User's Manual


Industry Sector, IA&DT
SCE Training Curriculum Page 8 of 42 To be used only at Educational and R&D Facilities
PA Module P03-01, Edition 09/2013 Unrestricted / © Siemens AG 2013. All Rights Reserved
P03-01_AdvancedLayout_R1309_en.doc
ACTIVEX CONTROLS
Curves are configured in OS engineering of PCS 7 either by setting up curve groups
(Chapter P02-03) or by using configurable ActiveX Controls. PCS 7 provides ActiveX
Controls for alarms, curves, and tables. Curves can be used to display time characteristics
(Online Trend Control) and also to display dependencies between process values
(Function Trend Control).
In the Online Trend Control, two different sources exist for displaying a curve. The first
source is the process value that is buffered while the ActiveX Control is active. With this
source, the trend can be displayed during monitoring. Here it is important that when
ActiveX Control is closed, the values can no longer be called. If the second source is used,
the data is taken from the archive (refer to P02-03). The process values taken from there
can be displayed again and again. Depending on the time span selected, past data
(history) can be called as well as the most recent data (prehistory). These values can be
called again as long as they are in the short term archive. The size of the short term
archive depends on the configuration as described in chapter P02-03.
Additional ActiveX Controls are the display of process values in tables (Online Table
Control) or of the alarms in alarm lists (Alarm Control). Alarm Control receives its data
always from the archive while the table, analogous to the Online Trend Control, has
different sources.
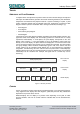
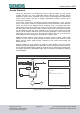
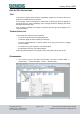
ActiveX Controls are quite suitable for designing detail displays, since they provide
additional information specifically for a detail area. To this end, specific process values for
the corresponding detail display or filters for alarm lists can be selected and preconfigured;
for example, by means of the attribute Origin. Figure 3 sketches a possibility for designing
the detail display.
Working area
Message list filtered by Reactor R001
Curve display with process values for Reactor R001
- temperature
- level
- manipulated value of the controller
- ...
M
M
PID-Regler
T
L
Detail display of Reactor R001
Figure 3: Layout for a detail display