Industry Sector, IA&DT SCE Training Curriculum for Integrated Automation Solutions Totally Integrated Automation (TIA) Siemens Automation Cooperates with Education PA Module P03-01 SIMATIC PCS 7 – Advanced Layout of UIs SCE Training Curriculum PA Module P03-01, Edition 09/2013 P03-01_AdvancedLayout_R1309_en.doc Page 1 of 42 To be used only at Educational and R&D Facilities Unrestricted / © Siemens AG 2013.
Industry Sector, IA&DT Matching SCE Trainer Packages for these curriculums SIMATIC PCS 7 Software block of 3 packages Order No. 6ES7650-0XX08-0YS5 SIMATIC PCS 7 Software block of 6 packages Order No. 6ES7650-0XX08-2YS5 SIMATIC PCS 7 Software Upgrade block of 3 packages Order No. 6ES7650-0XX08-0YE5 or 6ES7650-0XX17-0YE5 SIMATIC PCS 7 Hardware Set including RTX Box Order No. 6ES7654-0UE13-0XS0 Please note that these trainer packages may be replaced with subsequent packages.
Industry Sector, IA&DT ADVANCED LAYOUT OF UIS TRAINING OBJECTIVE After working through this module, the students have additional knowledge regarding the design of the user interface of an operator station. They are able to make additional information available on the detail level. To this end, they use adapted message lists and trend curves. The students are able to combine created composites into a user defined object and redesign existing objects as user defined objects.
Industry Sector, IA&DT THEORY HIERARCHY OF FLOW DIAGRAMS In chapter P02-01 the objectives of process control as well as of basic design concepts and techniques for OCM interfaces (operator control and monitoring interfaces) were described. Chapter P01-03 introduced the physical model of a system consisting of a plant, a plant section, equipment module and an individual control unit.
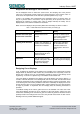
Industry Sector, IA&DT The Purpose of Curves Curves are displayed to show courses. By selecting different time horizons, different tasks can be implemented. Three variants exist in reference to the time the operator has the curve displayed. 1. The curve shows the past without the present. Such a curve is called history and is used for analysis. This can refer to a fault analysis but also to an analysis to optimize process control. 2. The curve shows the present with the recent past.
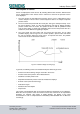
Industry Sector, IA&DT Acquisition and Storage of Curve Values For the displayed course to reflect the actual course, the sampling rate of the process value has to correspond at least to twice the change frequency of the process value. In most cases, this requirement can be met with cyclical acquisition every 1s [2]. In PCS 7, the sampling rate corresponds to the acquisition cycle of a process value. As long as a process value is not archive, only the pre-history of the process value can be displayed.
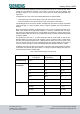
Industry Sector, IA&DT The curves should be displayed colored as continuous lines or as a series of dots. Color coding can be selected as required. The number of curves for each curve display field should be limited to six. The colors of the curves should be easily distinguishable from each other.
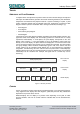
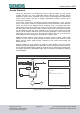
Industry Sector, IA&DT ACTIVEX CONTROLS Curves are configured in OS engineering of PCS 7 either by setting up curve groups (Chapter P02-03) or by using configurable ActiveX Controls. PCS 7 provides ActiveX Controls for alarms, curves, and tables. Curves can be used to display time characteristics (Online Trend Control) and also to display dependencies between process values (Function Trend Control). In the Online Trend Control, two different sources exist for displaying a curve.
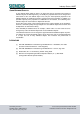
Industry Sector, IA&DT USER DEFINED OBJECTS A user defined object (UDO for short) is an object that can be dynamical and consists of individual objects. At OS Engineering, we identify the properties that can be changed and select them for the user defined object. Thus, only the most important properties of all individual objects are visible and provide a good overview of the properties.
Industry Sector, IA&DT STEP BY STEP INSTRUCTIONS TASK In this task, the display structure will be expanded by another level in order to show more detail for the individual tanks and reactors. In the example, create in the display for reactor R001 a detail view with a bar display for the reactor level, an online trend display and a message window for displaying the alarms associated with Reactor R001.
Industry Sector, IA&DT 2. Then, adapt the settings of the plant hierarchy to the expansion. ( Tools Plant Hierarchy Settings) 3. The number of hierarchy levels is retained. However, at the third level a checkmark has to be placed at 'Included in HID‘; otherwise, there may be problems during simulation. ( Included in HID OK Yes) SCE Training Curriculum PA Module P03-01, Edition 09/2013 P03-01_AdvancedLayout_R1309_en.
Industry Sector, IA&DT 4. Then, the block icons have to be generated in the new picture. ( Reactor R001 Plant Hierarchy Create/Update Block Icons) 5. Have the object name created from the chart names and include, as previously, a lower level hierarchy level. ( Object name: Chart Lower hierarchy levels included: 1 OK) SCE Training Curriculum PA Module P03-01, Edition 09/2013 P03-01_AdvancedLayout_R1309_en.
Industry Sector, IA&DT 6. Read the note regarding the compilation of the OS due now. The log can also be displayed. Confirm the dialog with ‘Yes’. ( Yes SCE Training Curriculum PA Module P03-01, Edition 09/2013 P03-01_AdvancedLayout_R1309_en.doc Page 13 of 42 ) To be used only at Educational and R&D Facilities Unrestricted / © Siemens AG 2013.
Industry Sector, IA&DT 7. Now, once more activate in the ‘Plant View’ Compile and Download Objects. ( SCE_PCS7_Prj PLC Compile and Download Objects) 8. Prior to starting the compilation, make sure that S7-PLCSIM is started and the CPU is in the ‘STOP’ mode. Regarding the charts, everything is compiled and downloaded. Regarding the OS, compile the entire OS (a general reset is not necessary) as recommended in Step 3.
Industry Sector, IA&DT 9. Now, in the ‘Component view’, start WinCC by highlighting and opening ‘OS(1)’. ( OS(1) Open Object) 10. In the folder ‘Graphics Designer’ open the picture ‘Reactor_R001.Pdl’. ( Graphics Designer Reactor_R001.Pdl) SCE Training Curriculum PA Module P03-01, Edition 09/2013 P03-01_AdvancedLayout_R1309_en.doc Page 15 of 42 To be used only at Educational and R&D Facilities Unrestricted / © Siemens AG 2013.
Industry Sector, IA&DT 11. Now, in the Object Properties, first change the geometry corresponding to your resolution (for example, 1024x616 at 1024X768) and the background colors to ‘white’. For the color setting to be accepted, the static in the global color scheme has to be switched to ‘No‘. ( Object Properties Colors Background color white Effects Global Color scheme No) SCE Training Curriculum PA Module P03-01, Edition 09/2013 P03-01_AdvancedLayout_R1309_en.
Industry Sector, IA&DT 12. Next, from the project library, drag in the face plate for reactor R001. ( View Library Project Library Reactor_V1_0) 13. In the picture ‘Reactor_R001.Pdl’, ungroup the group with the reactor in the center. ( Group Ungroup) SCE Training Curriculum PA Module P03-01, Edition 09/2013 P03-01_AdvancedLayout_R1309_en.doc Page 17 of 42 To be used only at Educational and R&D Facilities Unrestricted / © Siemens AG 2013.
Industry Sector, IA&DT 14. Next, select in the object palette Smart objects and then ‘Bar‘. Then position the bar over the reactor tank. ( Object Palette Standard Smart Objects Bar) SCE Training Curriculum PA Module P03-01, Edition 09/2013 P03-01_AdvancedLayout_R1309_en.doc Page 18 of 42 To be used only at Educational and R&D Facilities Unrestricted / © Siemens AG 2013.
Industry Sector, IA&DT 15. Now, in the configuration dialog, open the tag selection and as data source the ES variables; then open the hierarchy ‘A1_multipurpose_plant/T2_reaction/reactor R001/ A1T2L001/A1T2L001/Monitor…‘. On the right side, select the tag ‘PV#Value‘. ( ES Variables A1_multipurpose_plant/T2_reaction/reactor R001/A1T2L001/ Monitor_A1T2L001/PV#Value OK) 16.
Industry Sector, IA&DT 17. Now, the display is positioned exactly over the reactor and some levels are moved to the back (Arrange Within the level One to back) for the stirrer, the heater and the labeling to be visible again; then open the Properties for additional adaptations. ( Properties) 18. In the ‘Properties’ change to ‘Other‘ the 'TooltipText‘ in ‘A1T2L001‘.
Industry Sector, IA&DT 19. Then, select ‘Axis‘. Here, set the attribute ‘Scale‘ to ‘No‘. 20. In ‘Limits‘, specify the known low and high limit, their monitoring and the color of the bars if the limit is exceeded. ( Properties Bar Limits Low/high limit: refer to display/Monitoring: Yes SCE Training Curriculum PA Module P03-01, Edition 09/2013 P03-01_AdvancedLayout_R1309_en.doc ) Page 21 of 42 To be used only at Educational and R&D Facilities Unrestricted / © Siemens AG 2013.
Industry Sector, IA&DT 21. In the object palette, under the tab ‘Control‘ select the WinCC AlarmControl. Then draw a rectangle with the mouse. ( Object palette Controls WinCC AlarmControl) 22. Next, in the property dialog that is displayed automatically only change the text for window title to ‘Alarmlist reactor A1T2R001’. ( General Text: Alarmlist reactor A1T2R001) SCE Training Curriculum PA Module P03-01, Edition 09/2013 P03-01_AdvancedLayout_R1309_en.
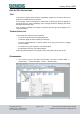
Industry Sector, IA&DT 23. In the tab ‘Message lists‘ select -as shown here- the ‘Message blocks’. Make the selection by adding message blocks with the buttons ; message blocks are removed with the buttons . So that only the alarms are displayed that match the picture, select ‘Fixed selection’. ( Message lists Fixed selection: Edit) 24. In the screen display below select as 'Criterion‘ the source, for Operand ‘contains’ and for Setting the text ‘R001’ as shown.
Industry Sector, IA&DT 25. Now, under ‘Online configuration’, select that the setting changes are not retained during runtime. ( Online configuration Online configuration: Do not retain OK) 26. In runtime of the PCS7 project, the alarms are now displayed in the picture ‘Reactor_R001’. Using the icon lost after a picture change. SCE Training Curriculum PA Module P03-01, Edition 09/2013 P03-01_AdvancedLayout_R1309_en.
Industry Sector, IA&DT 27. Next, select from the object palette, under the tab ‘Control‘, the WinCC OnlineTrendControl. Then, draw a rectangle with the mouse to position the window for the curve view. ( Object palette Controls WinCC OnlineTrendControl) 28. In the configuration dialog that is displayed automatically, at ‘Trends’ first change the object name of ‘Trend 1‘ to ‘PID – Setpoint‘.
Industry Sector, IA&DT 29. Next, link the trend to an archive tag by clicking on the button setpoint SP#Value of A1T2T001. ( Tag name ..ControlA1T2T001.SP#Value) SCE Training Curriculum PA Module P03-01, Edition 09/2013 P03-01_AdvancedLayout_R1309_en.doc Page 26 of 42 and then select the SystemArchive To be used only at Educational and R&D Facilities Unrestricted / © Siemens AG 2013.
Industry Sector, IA&DT 30. Now add another trend and apply the settings shown. ( Trends New Object name: ‘PID – actual value‘ Name: PV Tag name: Control_A1T2T001.PV#Value Limits High limit: 60 Apply) SCE Training Curriculum PA Module P03-01, Edition 09/2013 P03-01_AdvancedLayout_R1309_en.doc Page 27 of 42 To be used only at Educational and R&D Facilities Unrestricted / © Siemens AG 2013.
Industry Sector, IA&DT 31. The next trend is the manipulated value; it has the following settings. ( Trends New Object name: ‘PID – Manipulated value‘ Name: MV Tag name: Control.MV#Value Trend color: green OK Apply) SCE Training Curriculum PA Module P03-01, Edition 09/2013 P03-01_AdvancedLayout_R1309_en.doc Page 28 of 42 To be used only at Educational and R&D Facilities Unrestricted / © Siemens AG 2013.
Industry Sector, IA&DT 32. The last trend we add is the level A1T2L001. SCE Training Curriculum PA Module P03-01, Edition 09/2013 P03-01_AdvancedLayout_R1309_en.doc Page 29 of 42 To be used only at Educational and R&D Facilities Unrestricted / © Siemens AG 2013.
Industry Sector, IA&DT 33. Now change to the tab Time axes. There, set the parameters shown. ( Time axes Object name: Time axis Label: t Time range: 5 x 1 minute) SCE Training Curriculum PA Module P03-01, Edition 09/2013 P03-01_AdvancedLayout_R1309_en.doc Page 30 of 42 To be used only at Educational and R&D Facilities Unrestricted / © Siemens AG 2013.
Industry Sector, IA&DT 34. Then, in the register Value axes, set up three value axes: one for the temperature values of 0 .. 100°C, one for the manipulated value 0 .. 100% and one for the level of 0 .. 1000 ml. ( Value axes Object name: Value axis Temperature Label: °C Value range: automatic New …) SCE Training Curriculum PA Module P03-01, Edition 09/2013 P03-01_AdvancedLayout_R1309_en.doc Page 31 of 42 To be used only at Educational and R&D Facilities Unrestricted / © Siemens AG 2013.
Industry Sector, IA&DT 35. Now we assign the value axes to the trends. ( Trends PID – Setpoint: Value axis Temperature PID - Process value: Value axis Temperature PID Manipulated value: Value axis Manipulated variable Level: Value axis Level OK) SCE Training Curriculum PA Module P03-01, Edition 09/2013 P03-01_AdvancedLayout_R1309_en.doc Page 32 of 42 To be used only at Educational and R&D Facilities Unrestricted / © Siemens AG 2013.
Industry Sector, IA&DT 36. During the runtime of the PCS 7 project, the following trend is displayed in the picture ‘Reactor_R001’. 37. The steps below show how a number of objects can be grouped into a single ‘User defined object’. First, however, it is important that none of the included objects has been grouped. If such groups exist, they have to be ungrouped. ( Group Ungroup) SCE Training Curriculum PA Module P03-01, Edition 09/2013 P03-01_AdvancedLayout_R1309_en.
Industry Sector, IA&DT 38. Then, highlight all objects and right click on the selection. Now, select ‘Create customized object‘. ( Customized object Create) 39. In the configuration dialog, in the left window click on ‘User defined’ and select the first property of one of the customized objects that can be parameterized later in the finished user defined object. Drag this property into the left window to UserDefined2.
Industry Sector, IA&DT 40. In this manner, select from the object Bar1 the properties ‘Process Driver Connection’, ‘Maximum value’, ‘Minimum value’, ‘LimitAL’, ‘LimitWL’, ‘LimitAH’ and ‘LimitWH’. ( Bar1: Maximum value Bar1: Minimum value Bar1: LimitAL Bar1: LimitWL Bar1: LimitAH Bar1: LimitWH) 41. For the text window ‘Static Text2’ that describes the reactor, have the ‘Text’ displayed. Then, accept the user defined object with OK.
Industry Sector, IA&DT 42. Now, copy the finished user defined object to store it in the project library for later use. ( Copy) 43. Next, select the icon ‘ ’ to display the library. ( Project Library Insert ) 44. Next, change the name of the user defined object ‘customObject_reactor_V1_0’. ( customObjekt_reactor_V1_0 SCE Training Curriculum PA Module P03-01, Edition 09/2013 P03-01_AdvancedLayout_R1309_en.
Industry Sector, IA&DT 45. Now return to the user defined object in the picture ‘Reactor_R001.Pdl’ and select its properties ( Properties) 46. There, in the properties under Customized object, the selected properties for the subobjects are displayed under ‘Customized object’. For the ‘Process Driver Connection’ click on‘ ’ for ‘Dynamic’ and then select the tag. ( SCE Training Curriculum PA Module P03-01, Edition 09/2013 P03-01_AdvancedLayout_R1309_en.
Industry Sector, IA&DT 47. From the ES variables, select ‘A1_multipurpose_plant/T2_reaction/reactor_R001 /A1T2L001/A1T2L001/Monitor_A1T2L001/PV#Value’. ( ES variables A1_multipurpose_plant/ T2_reaction/reactor_R001/ A1T2L001/ A1T2L001/ Monitor_A1T2L001/PV#Value OK) 48. Now, for ‘Dynamic’, select an ‘Update Cycle’ of ‘1s’. Next, set the other properties as shown here. Then close the window.
Industry Sector, IA&DT 49. Finally, we should position the faceplates (picture blocks) correctly, label and save them. 50. Now, we want to use the customized object in the picture ‘Reactor_R002.Pdl’. To this end, set up a new picture in the plant view of the SIMATC Manager in the folder Reactor R002, and compile the changes of the OS(1). SCE Training Curriculum PA Module P03-01, Edition 09/2013 P03-01_AdvancedLayout_R1309_en.
Industry Sector, IA&DT 51. Now open the picture ‘Reaktor_R002‘ in the Graphics Designer. ( Graphics Designer Reactor_R002.Pdl Open picture) 52. By clicking on the icon ‘ ’ the libraries are displayed; from the ‘Project Library’ drag the ‘customObjekt_reactor_V1_0’ into the picture. ( Project Library customObject_reactor_V1_0) SCE Training Curriculum PA Module P03-01, Edition 09/2013 P03-01_AdvancedLayout_R1309_en.
Industry Sector, IA&DT 53. In the properties you can now access, under ‘UserDefined’, the selected properties of the customObject. Thus, you created an object with a specific selection of properties that can be used again and again quickly and effectively. ( Properties Object Properties UserDefined) 54. Finally, set the geometry, the background color and the deselection of the color scheme as you did in Step 11. Now, arrange the faceplates and insert a picture title.
Industry Sector, IA&DT EXERCISES In the exercises, we apply what we learned in the Theory section and the Step by Step Instructions. To this end, we use and expand the existing multi-project from the step by step instructions (PCS7_SCE_0301_R1305_en.zip). We are creating a new user defined object for the tanks with an upper and lower sensor. It can also be used to generate detail displays for the other plant sections.