
User's Manual


U3585-J-Z125-8-76 283
SM2 reports PERIODIC TASK report
Monitoring information
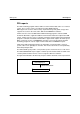
The first header line shows the report name and the sort criterion used (CPU, IO, UPG or
S-U for service units).
The second header line displays the following global system values:
TU+TPR Percentage of the (TU+TPR+SIH+IDLE) time accounted for by the
(TU+TPR) time
SIH Percentage of the (TU+TPR+SIH+IDLE) time accounted for by the
SIH time
IDLE Percentage of the (TU+TPR+SIH+IDLE) time accounted for by the
IDLE time
IO(/S) Total number of I/Os per second in the last cycle
(2 LM’S) Number of logical machines which were active
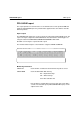
The PERIODIC TASK report contains data for the tasks selected with the SELECT-
PERIODIC-TASK-PARAMETER statement (see page 177). By default, the data of all tasks
is output.
D016ZE04 SM2 PERIODIC TASK (S-U) CYCLE: 120 S 99-03-24 14:30:00
TU + TPR= 45.2 % SIH= 10.5 % IDLE= 44.3 % IO(/S)= 402.8 ( 2 LM'S)
TSN | USERID | TYP |SERV-RATE|CPU-TIME| IO(/S)| UPG | PAG READ|
-----+----------+-----+---------+--------+--------+--------+---------+---------
9PF9 | CCC | DIA | 7089.3 | 6.6% | 0.1 | 14457 | 0.0 |
9XJM | LKLK | DIA | 5637.3 | 6.3% | 7.5 | 5423 | 0.0 |
9XI6 | LKLK | DIA | 2929.8 | 3.9% | 0.3 | 743 | 0.0 |
9RBI | DRR | DIA | 2677.7 | 3.0% | 18.5 | 2433 | 0.0 |
9XIW | LKLK | DIA | 2575.5 | 3.3% | 2.3 | 743 | 0.0 |
9XJA | SD222222 | DIA | 1527.7 | 1.6% | 8.9 | 506 | 0.0 |
BCAM | | SYS | 1356.2 | 0.2% | 191.7 | 818 | 0.0 |
9UYY | GRR | DIA | 1108.8 | 1.4% | 7.3 | 347 | 0.0 |
9XJN | SD222222 | DIA | 1062.2 | 1.1% | 8.9 | 506 | 0.0 |
9XIF | SD222222 | DIA | 916.5 | 0.9% | 8.9 | 506 | 0.0 |
SM2G | | SYS | 880.7 | 1.2% | 0.1 | 539 | 0.0 |
9XII | SD222222 | DIA | 808.4 | 0.8% | 8.9 | 496 | 0.0 |
9UMB | WBB | DIA | 750.5 | 0.9% | 0.7 | 1686 | 0.0 |
9XIZ | SD222222 | DIA | 748.7 | 0.7% | 8.9 | 506 | 0.0 |
9XJS | SD222222 | DIA | 734.1 | 0.7% | 9.8 | 515 | 0.0 |
9WJ7 | TSOS | BAT | 724.0 | 0.0% | 7.0 | 207 | 0.0 |