
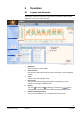
User Manual


9 / 14
Siemens EMC manual – Analysis module CM110903en_01
Building Technologies Operation 16.08.2009
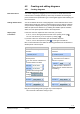
4.2 Creating and editing diagrams
4.2.1 Creating diagrams
You create a diagram by dragging one or more series or climatic data from the
node structure to a display window by click & drop. An window for entering the
period, resolution and presentation type of the diagram appears after releasing the
left mouse button.
You can set default values for creating diagrams in the Preselection area. These
default values simplify the creation of similar analyses. When creating a diagram,
an input window is displayed in which you can adjust individual values. You can
define the period to be absolute or, by enabling the "Relative period" checkbox,
select one of the preset periods relative to the analysis time.
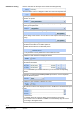
In the Tree view area, expand the tree to the node you require.
To do so, click on the appropriate horizontal arrows pointing to the right
You can close sections you do not require by clicking on
If you want to also use climatic data, open the Weather data area.
To do so, click on the expansion symbol
on the right of the title bar.
Next, in the Preselection area define the following parameters for the absolute or
relative period of future reports:
Absolute period Relative period
Disable the "Relative period"
checkbox:
Enable the "Relative period"
checkbox:
Enter the start and end times of the
absolute period:
You can click the calendar icon
for easier selection of dates
If dates are missing for the
period, EMD issues the error
message
.
Define the relative period:
Click the arrow to obtain a
selection of options
EMC provides a selection of
relative periods. Please select one
(mandatory).
Define the resolution to be used:
Define the resolution to be used:
Define the type of diagram:
Define the type of diagram:
Drag the corresponding node by drag & drop to the workspace.
This causes the "Add Series" dialog to open.
Brief instructions
Setting default values
Step-by-step
instructions