
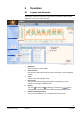
User Manual


10 / 14
Siemens EMC manual – Analysis module CM110903en_01
Building Technologies Operation 16.08.2009
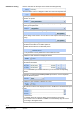
Enter a new name for the report in the Name text field (optional):
Select the basic color for a diagram or table from the Color dropdown list:
Select a predefined value from the Resolution dropdown list to specify the
resolution of reports:
Define the type of diagram/chart (bar, line, pie, etc.) by selecting one from the
"Chart type" dropdown list:
If you cannot see the following dialog items, click
The full dialog is then shown. You can return to the compact view at any time by
clicking
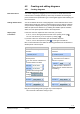
Define the type of reporting period:
– Enable the checkbox for a relative period or
– disable the checkbox for an absolute period
This parameter can be predefined in the Preselection area.
Enable the X-axis checkbox to display the X-axis:
Optional: If you selected an absolute period above: enter the start and end dates
and start and end times:
For comfortable input of dates and times you can click the corresponding
symbols.
Optional: If you selected the relative period option above: use the dropdown
listbox to select the period.
Enable the Y-axis checkbox to display the Y-axis:
Define the limit values of the displayed Y-axes in the Minimum and Maximum input
boxes:
Please note:
– If multiple charts are used, the setting must be made for each chart
– Set a value of zero for Maximum if EMC is to automatically align the Y-axis
according to the highest value
"Add Series" dialog