EMC manual Analysis module Building Technologies s
Siemens Switzerland Ltd Industry Sector Building Technologies Division Gubelstrasse 22 6301 Zug Switzerland Tel. +41 41-724 24 24 www.siemens.com/sbt © 2009 Siemens Switzerland Ltd Subject to change 2 / 14 Siemens Building Technologies EMC manual – Analysis module CM110903en_01 16.08.
Contents 1 Documentation Overview .......................................................................4 1.1 Revision History ........................................................................................4 1.2 1.2.1 1.2.2 1.2.3 1.2.4 Before You Begin ......................................................................................4 Copyright...................................................................................................4 Quality Assurance ............................
1 Documentation overview 1.1 Revision History Version Date Changes 1 16.08.2009 New document 1.2 Before you begin 1.2.1 Copyright Chapter Pages — — Reproduction and distribution of this document is only permitted with the express permission of Siemens and only for authorized persons / enterprises with appropriate technical expertise. 1.2.2 Quality assurance This document was created with the greatest possible care and attention. – The contents of all documents are regularly reviewed.
1.2.4 Graphical / typographical conventions Abbreviation Symbol EMC — — Meaning Usage in this manual Energy Monitoring & Controlling Drag & drop Click & drag Information — Drag & drop Click & drag Tip, additional information 5 / 14 Siemens Building Technologies EMC manual – Analysis module Documentation overview CM110903en_01 16.08.
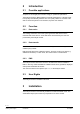
2 Introduction 2.1 Possible applications Analyses are an integral part of modern energy or operational optimization. The Analysis module in EMC enables economical weaknesses in customer plants to be quickly and efficiently detected. The user quickly obtains an overview of the data of connected systems in an interactive, dynamic user interface. 2.2 Function 2.2.1 Data series The building automation and control system generates data series from the individual data of the sensors.
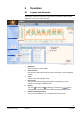
4 Operation 4.1 Layout and elements The Analysis module has a dynamic user interface. Its features include dynamic adjustment to the user's screen resolution. 1. Workspace Shows all diagrams and/or tables. 2. Node structure Drag & drop a data point from this tree to the workspace to create a diagram or table. 3. Views Used to create, edit and apply views. 4. Preselection Here you define the reporting period (relative or absolute), the report resolution and the type of diagram used. 5.
4.1.1 Workspace The workspace offers graphical and/or tabular views of data series in windows. A view can be quickly generated by means of dragging and dropping a data point (e.g., a counter) belonging to the node structure and climatic data to one of the preselected working windows. Different charts/diagrams can be created in a single window in this way. The number of diagrams that can be created in a window is only limited by the factor of clarity for the user.
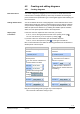
4.2 Creating and editing diagrams 4.2.1 Creating diagrams Brief instructions You create a diagram by dragging one or more series or climatic data from the node structure to a display window by click & drop. An window for entering the period, resolution and presentation type of the diagram appears after releasing the left mouse button. Setting default values You can set default values for creating diagrams in the Preselection area. These default values simplify the creation of similar analyses.
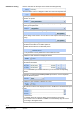
"Add Series" dialog Enter a new name for the report in the Name text field (optional): Select the basic color for a diagram or table from the Color dropdown list: Select a predefined value from the Resolution dropdown list to specify the resolution of reports: Define the type of diagram/chart (bar, line, pie, etc.) by selecting one from the "Chart type" dropdown list: If you cannot see the following dialog items, click The full dialog is then shown.
Once all parameters are defined, click the Confirm button. The program then starts to create the chart. During this time, a small clock with turning hands is shown . 4.2.2 Editing To edit a report, click the pencil icon. The icons button enable for editing and for deleting, as well as the diagrams and/or tables to be modified and exported after creation (refer also to creating diagrams above and editing diagrams below). 4.2.
Adjusting the period Clicking & dragging while holding down the Ctrl key causes the period to be altered as follows: – – – If the axis is dragged to the right, the value range is expanded If the axis is dragged to the left, the value range is reduced. Which of the two end points remains fixed in position depends on which side (starting from the middle of the axis) the operations are performed.
/ 14 Siemens Building Technologies EMC manual – Analysis module CM110903en_01 16.08.
Siemens Switzerland Ltd Industry Sector Building Technologies Division Gubelstrasse 22 6301 Zug Switzerland Tel. +41 41-724 24 24 www.siemens.com/sbt © 2009 Siemens Switzerland Ltd Subject to change 14 / 14 Siemens Building Technologies EMC manual – Analysis module CM110903en_01 16.08.