
User Guide


Trends
Trends Reference
7
221 | 393
Siemens
User Guide Version 3.0
A6V10415471
Building Technologies
2017-11-30
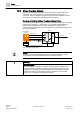
Figure 19:
Description
1
Timestamp for measurement.
2
Sorts values by ascending or descending timestamp.
3
Displays the trended object along with the property and alias of the object. It also displays
the corresponding color of the trended object in the graphical view.
4
Displays the values in a reduced manner and with a red background if a long time frame is
selected in the Trend View.
5
Displays the quality attribute with measured value, except Normal.
6
Displays interpolated values when this function is active.
NOTE: The priority is displayed in the table if a subsystem supports information on BACnet
write priority (1‒16).
7
Shows/hides the interpolated values.
There are two display types in table view:
● Normal view: The corresponding cell has a value or is empty.
● Interpolated view: The corresponding cell is empty and shows a linear
interpolated value based on previous current and subsequent current selection.
NOTE:
The table view only shows values as per the graphical time range. These values
are exported during data export.
1 2
43 5
6 7