
User Guide


Trends
Trends Reference
7
214 | 393
Siemens
User Guide Version 3.0
A6V10415471
Building Technologies
2017-11-30
11, 13
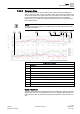
Timeline slide left/right. Click the end of the time range slider (dark grey area) and pull the
slider to the desired time/date position, which the tooltip continuously displays. The range
of the time window is changed at the same time you slide the end points.
12
Time range slider time window for the displayed window. Using the mouse, click the end of
the time range slider (dark grey area) and pull the slider to the desired time/date position,
which the tooltip continuously displays. The entered time window range is constant for the
function.
14
Tooltip: Time range of the displayed data.
15
Tooltip: Time and date of the oldest displayed data.
Direct Time Selection
Right-click the Time Range scrollbar to select the time directly. The exact time
range can be entered as:
● Absolute Time Range
● Relative Time Range
● Enter time range for trend.
Absolute Time Range
The absolute time range is suitable for displaying the data for a known time range.
To display the Trend View, you can directly define the start and stop times using a
calendar entry as well as the corresponding time entry.
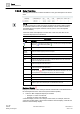
Relative Time Range
The relative time range is determined by a selectable time range (for example, 2
weeks) and depends on the current time. You can set the Interval (in [x] seconds,
minutes, hours, days, weeks, months and years) to display the data within the
optimum time range.
Time period
Current date
Start date End date
Data recording