
User Guide


Trends
Trends Reference
7
213 | 393
Siemens
User Guide Version 3.0
A6V10415471
Building Technologies
2017-11-30
8
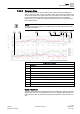
Online: Current value from the automation station.
Offline Trend: The values are displayed as a function of the time bar [3].
9
Displays time or date range display across the entire selected display range.
10
Displays time range scrollbar.
13
Displays time and/or date display for the grid.
14
Displays time range display between grid sections.
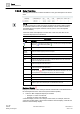
Time Range Scrollbar
In every Trend View, there are two time ranges of interest for analysis:
● Data displayed in the time range of the current chart (which is displayed directly
on the screen).
● Data in the time range of all available data.
Use the time range scrollbar to set the appropriate data range for your analysis.
Time Range Scrollbar
Description
1, 6
Repeat button left/right. The displayed timeline moves to the left or right if you click the
button at a ratio of 1:10 of the entered timeline. The corresponding repeat value displays
with a tooltip.
2
Value range for all stored data.
3, 5
Context menu: First/last time range for current Trend View.
4
Context menu: Time range for current Trend View.
7, 8
Tooltip: Repeat value.
9
Direct time selection for a freely definable time and date range.
10
Tooltip: Time and date of the oldest displayed data.
1 2 3
14
4 5 6 7
10 158
12 1311
9