
User Guide


Trends
Trends Reference
7
212 | 393
Siemens
User Guide Version 3.0
A6V10415471
Building Technologies
2017-11-30
NOTE 1:
The legend displays the last left measured value in the time bar.
NOTE 2:
In the legend, the displayed value is not displayed based on the intersection of
the time bar and trend curve. Instead, the time/date display is based on the time
bar position.
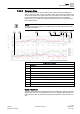
7.2.5.4 Trend View
The Trend View consists of a chart area where series are viewed and manipulated.
All the main elements such as the axes, scaling, titles and colors can be configured
in Trend View properties (by taking over defaults or changing the current Trend
View).
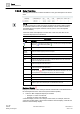
Trend View Worspace
Description
1
Displays the title of the current Trend View.
2, 11
Displays and highlights the selected trend curve in Trend View.
NOTE: To display a change of value on a binary value, an additional dotted zero line
displays at State 1 or One.
3, 12
Displays unselected trend curves as collapsed curves.
4
Displays the time bar. The time bar can be dragged anywhere on the time axis. The data
legend at the bottom of the Trend View displays the value or state valid at the point where
the bar intersects with the series. When the time bar is hidden, the legend displays the last
correct value for the Trend View.
5
Displays the present measured value for the series at the cursor. The current measured
value in a graphic curve is displayed by moving the mouse pointer to the desired position.
The precise measured points can be better displayed by enabling the marker for the series.
6
Displays the Y-axis with the appropriate scaling. Each chart can display a left and right Y-
axis independent of each other. Data series can be selectively assigned and scaled to
either axis (by default or manually).
7
Legend header.
1 2 3 4 5
6 7 8 9 10 11 12 13 14