Desigo™ CC Getting Started Version 2.
Copyright Notice Copyright Notice Notice Document information is subject to change without notice by Siemens Switzerland Ltd. Companies, names, and various data used in examples are fictitious unless otherwise noted. No part of this document may be reproduced or transmitted in any form or by any means, electronic or mechanical, for any purpose, without the express written permission of Siemens Switzerland Ltd.
Table of Contents About This Document ....................................................................................................... 5 Document Revision History ................................................................................................. 9 1 Introduction....................................................................................................... 10 1.1 Client Options ...................................................................................................
5.2 BACnet Scheduling ............................................................................................ 33 5.2.1 Adding a BACnet Schedule ................................................................ 33 6 Trends ................................................................................................................ 34 6.1 Online / Offline Trend ......................................................................................... 34 6.2 Trend View Comparison ................
About This Document Document Revision History About This Document Purpose This documentation introduces a “first time user” to the Desigo CC management station, including the basics such as how to start up and log on. It describes the different system environments and client modes, the system workspace and provides high level examples of plant monitoring and navigation workflows.
About This Document Document Revision History Liability Disclaimer We have checked the contents of this manual for agreement with the hardware and software described. Since deviations cannot be precluded entirely, we cannot guarantee full agreement. However, the data in this manual are reviewed regularly and any necessary corrections included in subsequent editions. Suggestions for improvement are welcome.
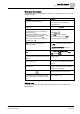
About This Document Document Revision History Document Conventions The following table lists conventions to help you use this document in a quick and efficient manner. Convention Examples Numbered Lists (1, 2, 3…) indicate a procedure with sequential steps. 1. Turn OFF power to the field panel. 2. Turn ON power to the field panel. 3. Open the panel. One-step procedures are indicated by a bullet point.
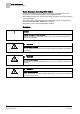
About This Document Document Revision History Safety Messages According ANSI Z535.6 The following examples show the ANSI standard safety messages used in this document to draw the reader’s attention to important information. ANSI distinguishes between personal injury safety messages and property damage warning messages. The personal injury safety messages have safety alert symbols and the following alert level labels: DANGER!, WARNING!, CAUTION! The label for property damage messages is: NOTICE.
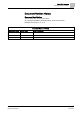
About This Document Document Revision History Document Revision History Document Identification The document ID is structured as follows: ID_Language(COUNTRY)_ModificationIndex_ProductVersionIndex Example: A6Vnnnnnnnn_en_a_02 Document Revision History.
1 Introduction Client Options 1 Introduction The Desigo CC management station presents a single face to the customer for building automation, fire safety and security systems, or a combination thereof. Offering scalability of all configurations and allowing need-based expansion from small and medium to large and complex systems, Desigo CC provides customer and market-specific solutions. For details about operating workflows, see the User Guide (A6V10415471).
First Steps Starting the Client and Logging On 2 2 First Steps This section introduces you to the following topics: How to launch and log on to the Desigo CC client Overview of the system screen, including a brief description of the main features Basic operational workflows How to end your session 2.
2 First Steps Starting the Client and Logging On 2.1.2 Launching a Web Client You want to operate Desigo CC as a browser-based web application. 1. Launch Microsoft Internet Explorer. 2. In the address bar of the browser, enter the name of the computer where the Desigo CC Web Server resides (for example, //ITP0990c/). NOTE: If you do not have this information, please contact your system administrator. The Desigo CC page opens in the browser, and the Desigo CC tab contents display. 3.
First Steps Starting the Client and Logging On 2 The installation of Desigo CC starts. When completed, the initialization splash screen displays for a few seconds. Then the logon dialog box displays. 5. Enter your username and password. 6. Select the domain. 7. Click Logon. NOTE: Each time you launch Desigo CC as a Windows App Client, a search for system updates is performed.
2 First Steps User Interface 2.2 User Interface The exact screen layout will vary depending on your particular system’s configuration, and you may not see all the components described. Item Name Description 1 Summary bar The main point of entry to all the functions of the software. Provides an overview of the events in the system.
First Steps User Interface 2.2.1 2 Graphical Elements and Controls Layout and Panes The system screen can display many windows, some of which are made up of multiple panes, divided by splitters. A window can contain up to four panes. Each pane houses a functional component of the Desigo CC system (for example, a browser for navigating and selecting system objects, a viewer for displaying site floor plans, tools for inspecting the properties of objects, and so on).
2 First Steps Operating and Engineering Mode Resize the panes in a layout by dragging the splitters, or expand/collapse a pane by clicking the button on the splitter Click the icon to lock the window layout . . When the layout is locked, clicking one of the layout icons will not have any effect; this means that you cannot change the current layout, and resize, expand, or collapse the panes of the window. Normally, the Secondary pane opens on demand, when you make a selection that requires it.
First Steps Operational Workflows 2 and Engineering mode. Authorized users can switch System Manager to Engineering mode which is used to set up and configure the system. System Manager - Engineering Mode System Manager – Engineering Mode Item Description 1 System Manager Engineering mode is identified by a light pink color. 2 Depending on the object selected in System Browser, multiple engineering tabs may display in the Primary pane header.
2 First Steps Operational Workflows 3. Click a related item link (5) (for example, New Remote Notification) to open that resource in the Secondary pane. The selected related item displays in the Secondary pane (6). 4. If necessary, click the icon (7) to display the navigation bar (8) with icons for moving back and forth between the most recent screens in the Primary pane and going back to the favorite location. 2.4.
First Steps Ending Your Session 2.5 2.5.1 2 Ending Your Session Usually when you want to end your session you exit [➙ 19] Desigo CC. In Closed mode, you can only log off [➙ 19] from your session. Exiting the System You are running Desigo CC (as an Installed Client, Web Client, or Windows App Client) and you want to end your session. In the Summary bar, select Menu > Exit. Desigo CC shuts down. If you were running Desigo CCin Internet Explorer, the logon dialog box displays on the screen. 2.5.
2 First Steps Troubleshooting the Web Client and Windows App Client 2.6 Troubleshooting the Web Client and Windows App Client If there are connectivity problems, a message box may display indicating that the connection to the server was temporarily lost. Proceed as follows steps to resume working: 1. Click OK to close the message box. The system automatically logs you off, and the logon dialog box displays again on the screen. 2. Try logging on again.
Events How Events Display in the System 3 3 Events Events are first detected by the sensors in the field according to the programmed thresholds and algorithms. The related field panel is responsible for the acquisition and local event signals, as well as transmitting the information to the management station where the operator can follow the prescribed treatment procedures and provide the required counter-measures to deal with the dangerous or abnormal condition. 3.
3 Events Handling Events 3.2.1 Using Fast Treatment The following procedure is recommended when handling an alarm that only requires sending specific commands. No further investigation or control action is required. An alarm occurs in the system, the event lamp relating to its category flashes in Summary Bar, and a new event button appears and flashes in Event List. The event status is Unprocessed, and the suggested action is Select the event. 1. In Event List, click the event button, for example: .
Events Handling Events 3 2. Click Acknowledge . The event is acknowledged, and the event status changes to either Waiting for condition or Ready to be closed. 3. If the below commands are available, do one or both of the following; otherwise, proceed to Step 4: – Click Silence , to silence the field panel. – Click Start Remote Notifications , to manually send a remote notification message. 4.
3 Events Handling Events the top, and the operating procedure in the left pane. The operating procedure contains all the steps that must (or optionally can) be executed, presented in sequential order. The first step is already selected, and the Primary pane displays the appropriate tool for carrying it out. 2. Click Acknowledge . The event is acknowledged. 3.
Events Journaling Printouts 3.3 3 Journaling Printouts The management system can be configured to print out a log of the system’s operation.
4 Graphics Viewing Graphic Objects 4 Graphics The Graphics application allows you to create, view, store, and command large graphics representing equipment, floors, buildings, facilities, and entire campuses. These graphical representations can contain dynamic elements to represent devices or values you want to monitor or control. The three main components that make up the Graphics application are the Graphics Viewer, the Graphics Editor, and the Graphics Library Browser.
Graphics Commanding 4 Primary and Secondary Selections When you select a graphics object from System Browser, the Graphics Viewer displays the representative graphic. The selected object is considered the primary selection. The object properties also display in the Property Viewer. The graphic that has the primary selection displays the name of the graphic according to your Display selection in the System Browser, in the upper, left-hand corner of the primary pane.
4 Graphics Creating a Graphic Enable/disable On/Off Out of service Override/Release Reset value for equipment runtime Set a new point value Toggle alarmable/not alarmable status Upload Display of Properties on a Graphic Properties display on a graphic in one of two ways—automatically or manually. They display automatically when a property goes into an off-normal state. The Status and Command window displays the icons associated with the properties in an off-normal state on the graphic.
Graphics Creating a Graphics Sub-Folder 4.4 4 Creating a Graphics Sub-Folder You want to create a graphics sub-folder. 1. In System Browser, select Application View, and then navigate to and click on Graphics. The Graphics Viewer displays in the Primary pane and you are in Operating mode. 2. From the Graphics toolbar, click Create New The New Folder dialog box displays. , and click New Folder. 3. In the Folder Name field, type a name for the new folder. 4. Click OK. One of the following occurs.
4 Graphics Commanding Off-Normal Properties If the command button has arguments associated with it, go to the next step. 4. Complete the required fields if any are associated with the command. 5. Click Send. The system displays the status of the command. 4.7 Commanding Off-Normal Properties You have a graphic open in Graphics Viewer, and one or more objects have properties in an off-normal state. The system has displayed the objects and the icons of the properties that are in an off-normal state.
Graphics Deleting a Graphic Item 4.9 4 Deleting a Graphic Item You want to delete a graphic item, a graphic or a folder, from the Graphics folder. You are in Operating mode and the Graphics Editor is displayed. 1. In System Browser , select Application View, and then expand the Applications folder. The list of available applications display. 2. Expand the Graphics folder. 3. Navigate to and click the graphic or graphic folder you want to delete.
5 Scheduler Management Station Scheduling 5 Scheduler The Scheduler component of the management system enables you to: Set up schedules to automate the operation of the building control site: Schedules are defined on a weekly and daily basis. You can specify a different hourly timetable for each day of the week. For example, you could schedule a heating system to work from 9 a.m. to 6 p.m. on Mondays and Fridays and from 8 a.m. to 8 p.m.
Scheduler BACnet Scheduling 5.2 5.2.1 5 BACnet Scheduling BACnet scheduling allows you to automatically issue commands to field points at prescribed time intervals. You can create daily or weekly schedules (and exception calendars) for BACnet field panels. Each BACnet panel stores its own calendar and schedule objects, and a BACnet panel can store and run multiple calendars or schedules at the same time.
6 Trends Online / Offline Trend 6 Trends A key functionality of a management system is the acquisition and recording of measured values from the customer site. For example , you might want to track the readings of: a room-temperature sensor over time the energy consumption patterns of an air cooling unit the status of an air handling unit This kind of historical data is called a trend. The measured value (such as, a temperature) that you track in a trend is called a data point.
Trends Trend View Comparison 6 Offline Trend Offline trends are used for the longer-term storage and retrieval of historical data to analyze a specific process or an entire facility. Offline trend data is recorded and stored locally, directly in the automation station. Phase 1: Record offline trend data Trend data is saved locally to a Trendlog object in the automation station. Phase 2: Upload offline trend data Trend data is uploaded if: 6.2 6.2.1 The max. buffer size is reached.
6 Trends Example: Create and Store a New Trend View Item Description 1 Current Trend View. 2 Compare View. 3 Time bar with time displayed in the comparative view. 4 No offset. 5 Predefined offset buttons. 6 Freely definable offset range (range, unit). 7 1x forward or 1x back for the selected offset range. 8 Freely definable offset range in hours, days, weeks, years.
Trends Example: Analyze Trend Data 6 4. In System Browser, select Management View. 5. Select Project > Field Networks > [Network Type] > Hardware > [Device]. 6. Under [Device], find the data point whose trend you want to track in the new trend view (do not click the data point). 7. Drag-and-drop the data point to Trends. 8. (Optional) Repeat Steps 5 through 7 to add other data points to the trend view. 9. Click Save As . The Save Object As dialog box opens. 10.
6 Trends Using Comparative View 6.5 Using Comparative View The comparative view is ideal for extended data analysis with time offset. You are in a Trend View and Manual mode is on. The property window of the Trend View is closed. The time period for display is defined using the time range scrollbar. For example, 12 hours. 1. Click Stop . 2. Click Compare View to open a comparative view. The same Trend View displays a second time. 3. Define the appropriate time/date range with the scrollbar. 4.
Reports Reports Workspace 7 7 Reports A report is a formatted and organized presentation of data. The Reports application lets you configure and produce a variety of reports on the functioning of the building control system. To compose a report, you configure a Report Definition that specifies: The elements that you want to include in the report (such as tables, plots, logos, form controls, text and so on), and their layout.
7 Reports Reports Workspace Reports Workspace Item Name Description 1 System Browser Displays all saved Report Definitions under the main Reports folder. 2 Reports Toolbar Contains icons for performing various actions in Reports. 3 Reports Ribbon Contains several tabs and group boxes to help you create a Report Definition. The tabs available on the ribbon are: Home, Filter, Layout, Data, and Settings.
Reports Reports Workflow 7.2 7 Reports Workflow This section describes working with reports in the Primary and Secondary panes, and the Contextual pane. NOTE: For Reports, you can perform the same tasks in Operating as well as Engineering mode.
7 Reports Creating, Configuring, and Saving a Report Definition Reports Workflow 7.3 Creating, Configuring, and Saving a Report Definition 1. In System Browser, select Application View 2. In the navigation tree, select Applications > Reports. Reports displays in the Primary pane. 3. In the Reports toolbar, click New . 4. From the context menu that displays, click New Report . A new Report Definition opens in Edit mode.
Reports Generating a Report from a Report Definition 7 If confirmed, the Report Definition is saved. 7.4 7.4.1 Generating a Report from a Report Definition You can generate a report from a configured Report Definition either manually or automatically. You can generate a report manually to display in the Reports workspace according to your login language (Run) or according to the selected language (Run As).
7 Reports Viewing a Report as a PDF or XLS 7.4.2 Generating a Report Manually from Related Items Tab 1. Select an object from the System Browser tree. For example, Field Networks. This object is set as the name filter for the report definition you want to execute. 2. In the Related Items tab, select an icon/link for the Report Definition. For example, Object Status. You must import the report that you want to execute. NOTE: Do not select an icon/link for New Report as this opens a new Report Definition.
Reports Viewing a Report as a PDF or XLS 7 PDF You can view and save the report output in a PDF document. A PDF document contains all the report elements of the Report Definition with output data and sorting applied. It also displays the special formatting applied to Report Definition elements (such as tables, plots, keywords, and so on). The PDF document can have a maximum of 500 pages, if the number of pages exceeds 500 the document splits into two.
7 Reports Viewing a Report as a PDF or XLS Excel (XLSX) You can view and save the report output as an Excel (XLSX) document. An Excel document contains all of the reporting elements of the Report Definition with output data and user defined configuration (if applied). Form Controls (if present) in the report definition are not present in the Excel document. Any special formatting applied to the Report Definition elements are not retained in the Excel document.
Reports Viewing a Report as a PDF or XLS 7 View as XLSX_PivotTable An Excel document can have a maximum of 1000 worksheets (0 through 999). Each sheet can have a maximum number of 10,48,575 rows. If all the 1000 worksheets are filled with data, then a new Excel file is created for the next set of records. NOTE: To view and save an Excel document, you must have Microsoft Office Excel 2007 or later installed. Microsoft Excel is not installed with the management system.
8 Log Viewer Overview of Log Viewer 8 Log Viewer 8.1 Overview of Log Viewer The Log Viewer application lets you directly view the historical data of all management system activities and events without having to create and configure a report from the Reports application. Log Viewer displays this historical data as a multi-column table that contains two types of records: Activity records concern actions done by users or by the system itself.
Log Viewer Log Viewer Workspace Item 8.2.1 8 Name Description 1 System Browser Displays all the saved Log View Definitions in Application View, under the folder Applications > Log Viewer. 2 Log Viewer Toolbar Contains buttons for performing various actions in Log Viewer. 3 Log View Displays the combined data from the activity log and event log. 4. Dropdown Arrow When clicked, displays a menu with options to select columns, hide columns, apply filters, and remove filters.
8 Log Viewer Log Viewer Workflow Primary pane from any application, the Detailed Log tab displays the latest 100 activities and event log records for the object. An activity or event type record is selected from the log view - When you select an activity type record from a log view, the latest 100 activities and event logs for the selected object display in the Detailed Log tab.
Log Viewer Creating, Configuring, and Saving a Log View Definition 8.3.2 8 Viewing Log Data You can view log data using any of the following procedures: Selecting the Log Viewer root node or a folder below it from System Browser This displays the combined data from the activity and event logs. Selecting a saved log view definition from System Browser - This displays the data, applying all the configurations you set up in the selected log view definition.
9 Help System 9 Help System The following help features are available to you at any time during your work session: Type Provides... Available using.... Help Online help.
References References to Product Documentation Set References See the following for system-related resources.
References Support Addresses/Feedback/Links Support Addresses/Feedback/Links The following contains important contact information for Desigo CC systems, as well as other useful links. Customer Support Support mailbox: fieldsupport-zug.ch.sbt@siemens.com. Microsoft General support about Microsoft Windows can be found at: http://support.microsoft.com/directory/ Adobe Acrobat To view PDF documents you need to install Adobe Acrobat Reader. You can find the latest free version at: http://get.adobe.
References Support Addresses/Feedback/Links 55 Siemens Building Technologies Desigo™ CC Getting Started A6V10415475_en_a_21 2015-06-30
Issued by Siemens Switzerland Ltd Building Technologies Division International Headquarters Gubelstrasse 22 CH-6301 Zug Tel. +41 41-724 24 24 www.siemens.com/buildingtechnologies Document ID A6V10415475_en_a_21 Edition 2015-06-30 © Siemens Switzerland Ltd, 2015 Technical specifications and availability subject to change without notice.