
Engineering Documentation
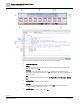
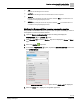
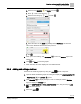
Table Of Contents
- Copyright Notice
- 1 About this document
- 2 Desigo Control Point Operation engineering topics
- 2.1 Tool-free configuration of a Desigo Control Point device
- 2.1.1 Connecting to the Desigo Control Point device
- 2.1.2 Performing the initial login
- 2.1.3 Configuring the Network port for IP (PXG3.Wx00 and PXM… touch panel)
- 2.1.4 Activating the application (PXG3.Wx00 and PXM… touch panel)
- 2.1.5 Assigning devices to the Desigo Control Point device
- 2.1.6 Updating the Network port for a browser connection (PXM… touch panel)
- 2.1.7 Subscribing to the time master and time synchronization for Assigned devices
- 2.1.8 Configuring for kiosk graphics on a touch panel
- 2.2 Tool-free commissioning of the Operation application
- 2.3 Data point integration overview
- 2.4 Plant view Tools
- 2.4.1 Using the graphics wizard to create a graphic
- 2.4.2 Editing a graphic
- 2.4.3 Removing a graphic
- 2.4.4 Displaying the URL of a graphic
- 2.4.5 Exporting graphics for sharing across jobs
- 2.4.6 Importing graphics
- 2.4.7 Enabling graphics and kiosks for room users to view
- 2.4.8 Defining graphics as a startup page
- 2.5 Working with kiosk graphics
- 2.6 Using engineering notations
- 2.1 Tool-free configuration of a Desigo Control Point device
- 3 Graphics engineering with Graphics Builder
- 3.1 Graphics Builder overview
- 3.2 Using the Builder pane tools
- 3.3 Graphics libraries
- 3.4 Workflows
- 3.5 Working with dashboards
- 3.5.1 The Facility manager dashboard user interface
- 3.5.2 The Public dashboard user interface
- 3.5.3 Adding and editing a text box
- 3.5.4 Adding or replacing a background image
- 3.5.5 Adding information from a trended data point
- 3.5.6 Adding external media to a dashboard
- 3.5.7 Working with gauges
- 3.5.8 Editing charts
- 3.6 Creating end-user room graphics
- 3.7 Advanced functionality
- 4 Tips and tricks
- 4.1 Updates required after a time zone change
- 4.2 APPLY BATCH TAGS > Custom Filter button is reserved for future use
- 4.3 Graphic components within models cannot be modified
- 4.4 A graphic with relative binding that includes data points from different branches of the hierarchy cannot be created at the Root level
- 4.5 Relative hyperlinks cannot be added to a graphic at the Root level
- 4.6 Relative hyperlinks in a graphic are broken if the graphic is engineered offline and then imported to another device
- 4.7 Haystack interface
- 4.8 Automatic logout from the Operation application causes Graphics Builder to temporarily stop working
- Index

Graphics engineering with Graphics Builder
Working with dashboards
94 | 138
Siemens
A6V11211560_enUS_b
Building Technologies
2019-01-15
Figure 10: Elements of the Ractive components that display resource consumption.
①
The Ractive component
②
fillColor
The color of the icon. You can use any of the 140 valid CSS color strings supported by modern
browsers. In this case, it’s red.
numIcons
The number of icons displayed. In this case, it’s 10. The number of icons displayed in color
represents the average daily consumption as a percentage of the maximum daily consumption over
the last four weeks.
icon
The icon for the household devices. Options are: washing-machine, oven, fridge, light or lightning-
bolt.
③
descriptionText
Free-form text describing the average calculation.
④
avgValue
The average daily consumption over the last four weeks. Note: Do not edit this value. It is
overwritten once the graphic displays live data.
⑤
oneCycleValue
Can be any positive number. In this case, it’s 72.